Figures & data
Figure 1. The supply chain system with hybrid recycling channel and sales game.
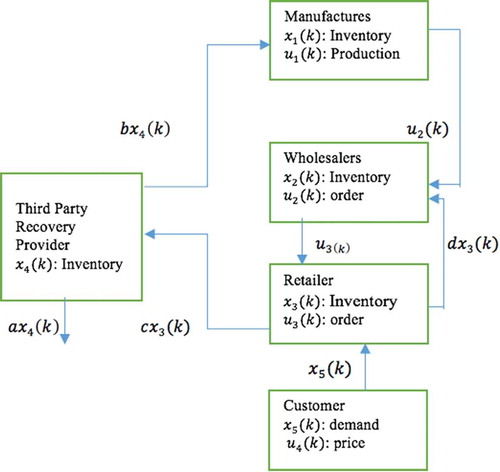
Table 1. Notations.
Figure 2. Frequency responses of in the case of complexity dynamic for various lead time.
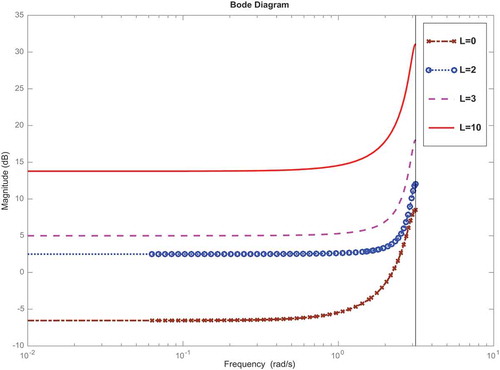
Figure 3. Frequency responses of in the case of complexity dynamic for various gain.
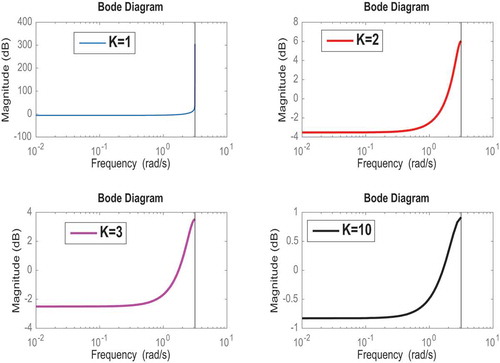
Figure 4. Frequency responses of in the case of complexity without any lead time and gain.
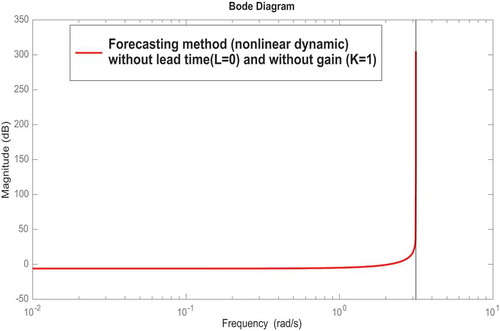
Figure 5. The magnitude ratio of transfer function for all nodes.
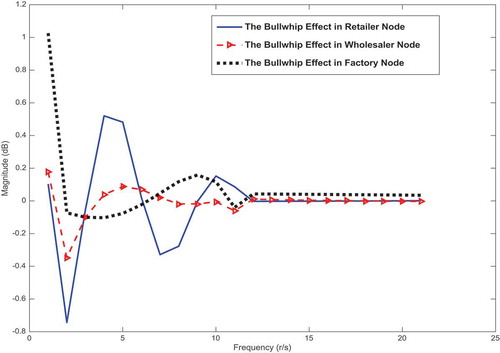
Figure 6. Frequency responses of for various variance noise (process and measurement noise).
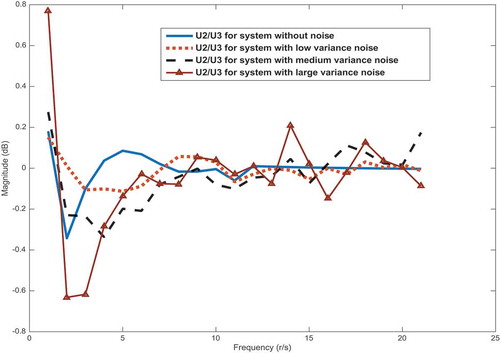
Figure 7. Frequency responses of for all nodes with same variance noise.
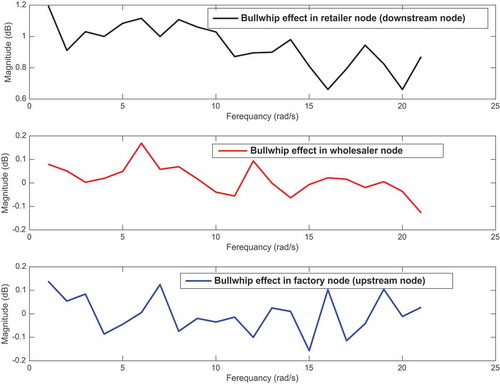
Figure 8. The bullwhip effect in supply chain without controller and supply chain with controller.
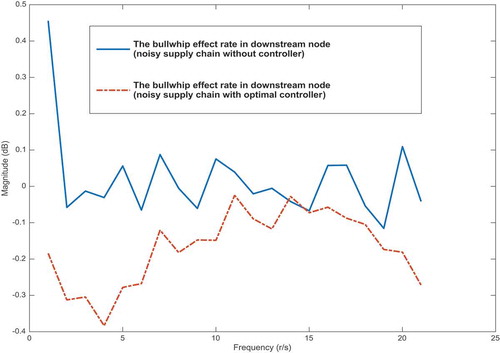
Figure 9. The bullwhip effect in supply chain without controller and supply chain with controller.
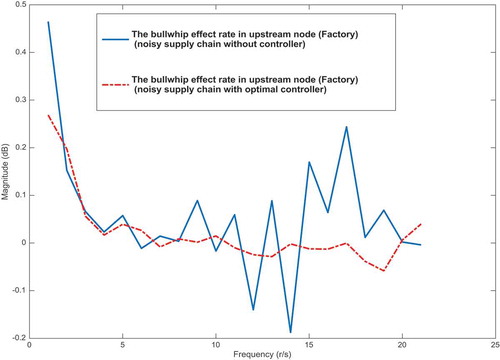
Table 2. Simulation data.
Figure 10. Output of closed-loop supply chain (system with optimal controller).
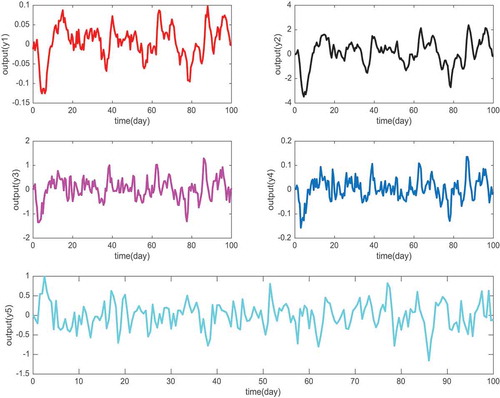
Figure 11. Optimal policy.
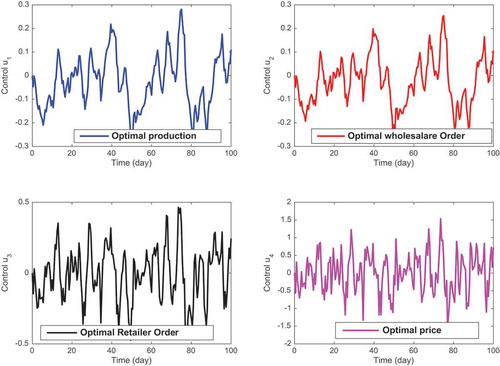
Figure 12. LQG tracker.
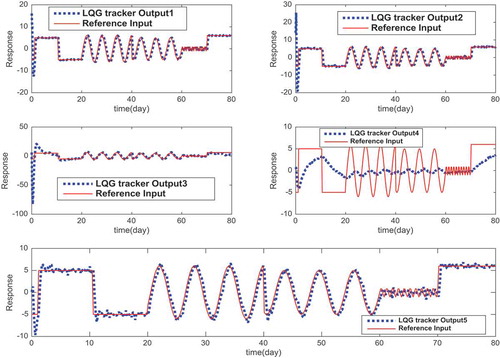
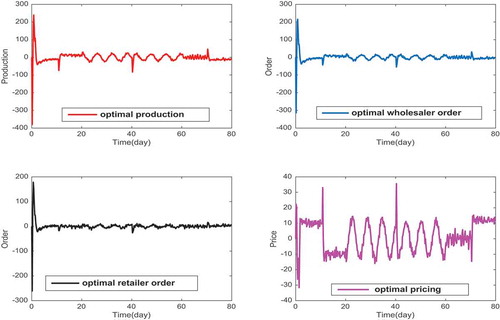
Figure 13. Optimal order, production and pricing.