
Figures & data
Figure 1. Quarter-bus model (3-DOF)
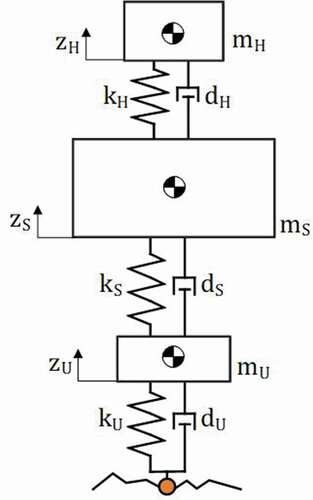
Figure 2. Half-bus model (6-DOF)
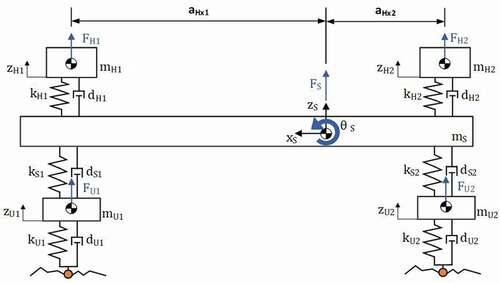
Figure 3. Full-bus model (9-DOF)
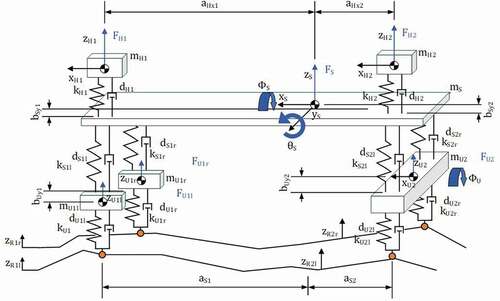
Table 1. Bus model parameters human & seat
Table 2. Bus model parameters: sprung mass
Table 3. Bus model parameters suspension & unsprung mass
Figure 4. The flowchart of the experimental set-up
Figure 5. Field measurement set-up a) selected road segment; b) portable accelerometer
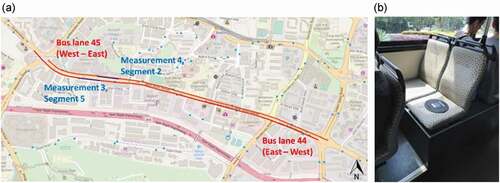
Figure 6. IRI value of the Bus lane 45 for every 100 m with four sections (I, II, III, IV) for further investigation (a) left-wheel track; (b) right-wheel track
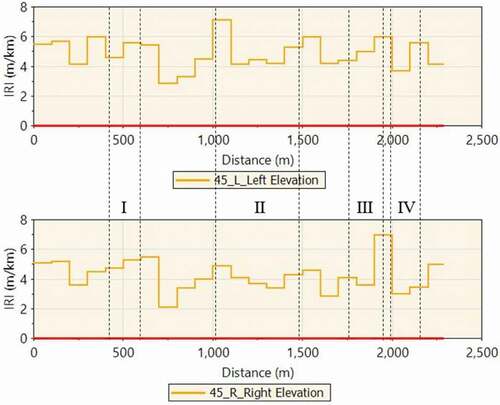
Table 4. Levels of comfort corresponding to root-mean-square acceleration in ISO 2631–1
Figure 7. The frequency-weighted awz_simulation(t) and awz_measurement(t) at different sections for the right-wheel-track only
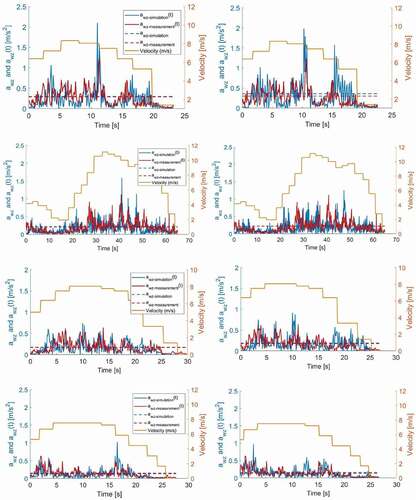
Figure 8. Awz_simulation/awz_measurement ratios at different sections and the average ratios (standard deviation) (a) using both wheel tracks; (b) using only the right-wheel track where the field measurement was taken
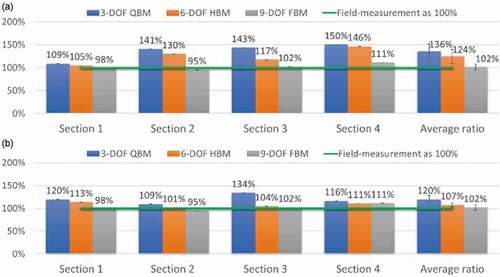
Figure 9. The difference in response from transfer functions of IRI-QCS and QBM as temporal frequency (Hz) and spatial frequency (cycle/m)
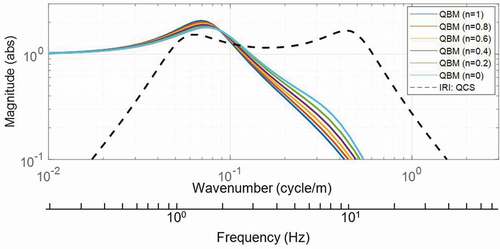
Table 5. Comparison of output between different vehicle type modelling, in which simulated results from full-vehicle model is equivalent to the field-measured data