Figures & data
Figure 1. Overview of the diesel engine structure including the engine control unit.
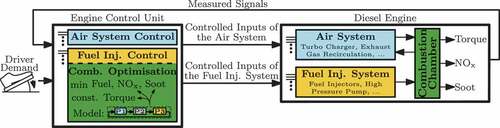
Figure 2. Overview of variables to describe the cylinder chamber.
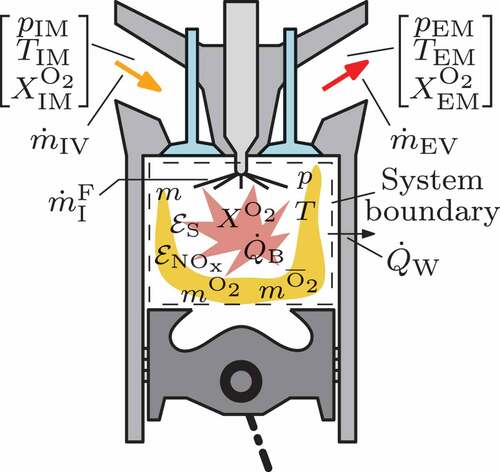
Figure 3. Hybrid automaton-like structuring of the engine cycle into the gas exchange, compression, and combustion phase.
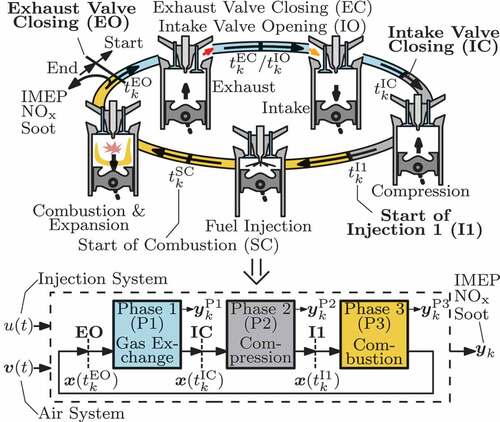
Figure 4. Shape parameter of the fuel mass flow rate and their dynamic correction values.
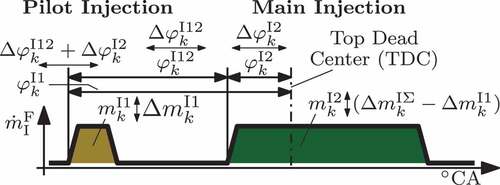
Figure 5. Extension of the conventional fuel injection control scheme with a dynamic correction approach to improve the transient engine operation.
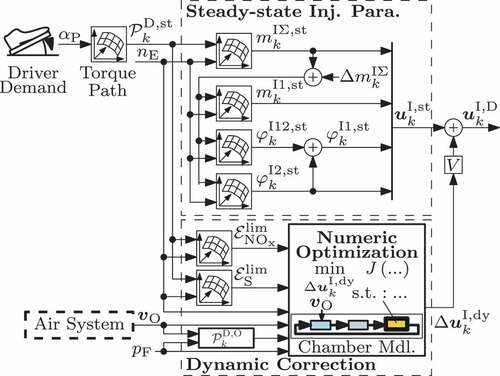
Figure 6. Visualisation of the effect of the emission optimisation limit
in the objective function.
Figure 7. Overview of the test bench structure focussing on the sensors that are located in the intake and exhaust manifold.
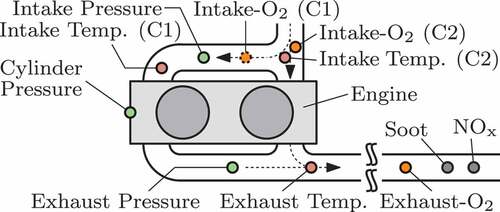
Figure 8. Visualisation of the main relations between the air system actuators and the cylinder state of the data-based model input
.
Figure 9. Visualisation of limits of the variation variables and the desired data points (black dots).
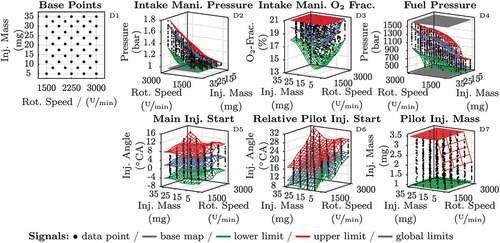
Figure 10. Assembly of input-output samples of the training and test data sets at calibration step one and two for the generation of the data-based models of the optimisation problem (17).
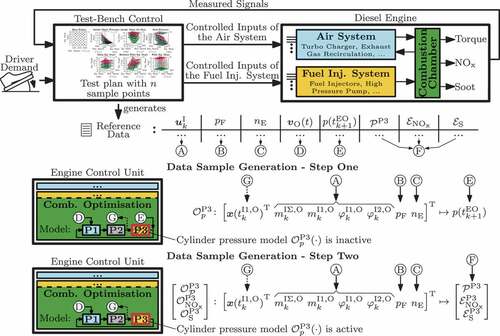
Figure 11. Evaluation of the data-based models and
.
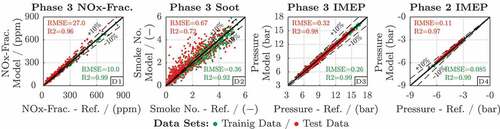
Figure 12. Concept for processing a data point to inherently satisfy the IMEP constraint equation (37).
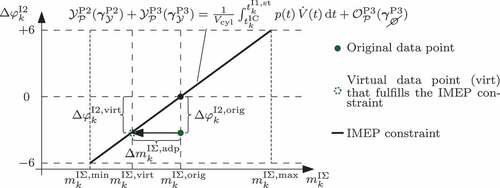
Figure 13. Evaluation of the data-based models .
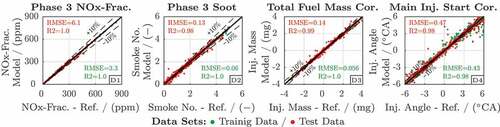
Figure 14. Concept for deriving data-based models that substitute the online optimisation to determine the fuel injection correction .
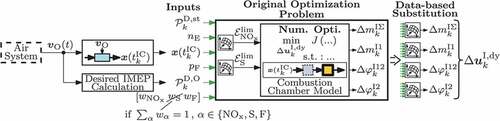
Figure 15. Sampling concept of the optimisation problem to derive training and test data for the data-based models . The weight variation cases V1 and V2 are investigated.
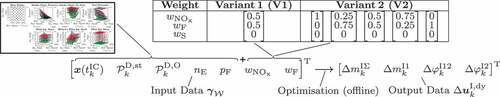
Figure 16. Evaluation of the data-based models of the weight variation cases V1 and V2.
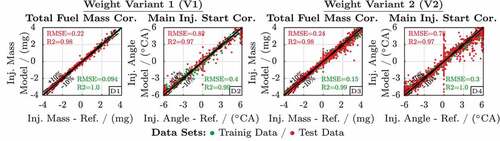
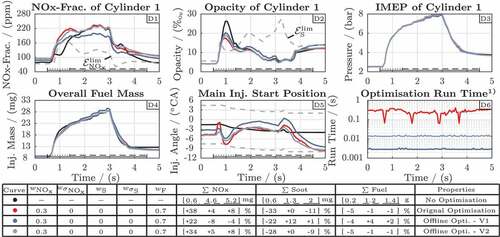
Figure 17. Comparison of the speed-up measures for the optimisation problem (17). 1) Each approach also simulates the gas exchange phase once per cycle which requires in addition.
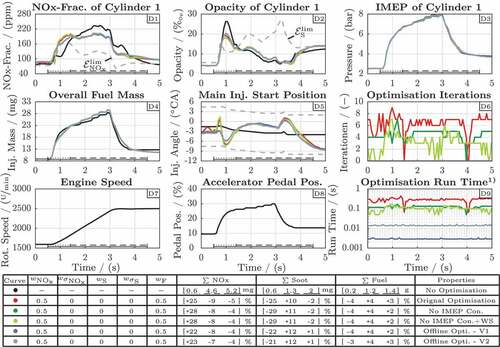
Figure 18. Test of the data-based correction models V1 and V2, see , for a weight factor configuration that is not included in their training data. 1) Each approach also simulates the gas exchange phase once per cycle which requires in addition.