Figures & data
Figure 1. Procedure for RSM [Citation34].
![Figure 1. Procedure for RSM [Citation34].](/cms/asset/9d38cf3e-8baa-47bc-9b0b-510674b0205a/nmcm_a_2143531_f0001_oc.jpg)
Table 1. Variables that affect the damping ratio.
Figure 2. Damping ratio () vs. individual variables.
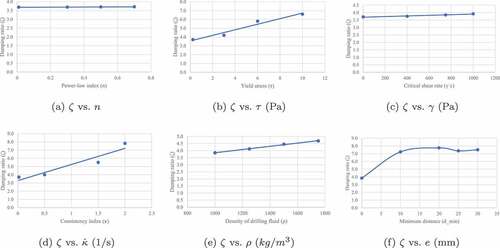
Table 2. Experiments and the respective results.
Figure 3. The approximation to a spring-mass-damper system.
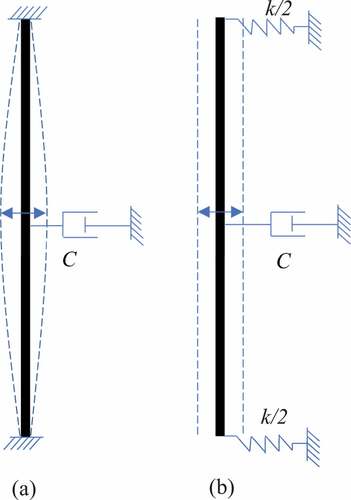
Figure 4. Repeating unit of the lumped segment model.
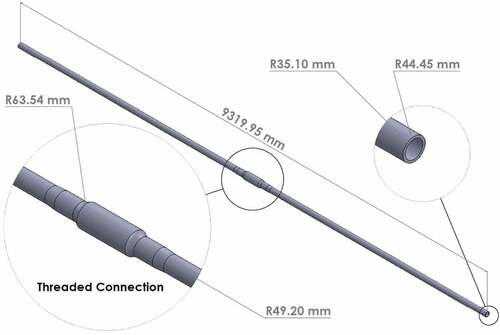
Figure 5. - Predicted vs. actual.
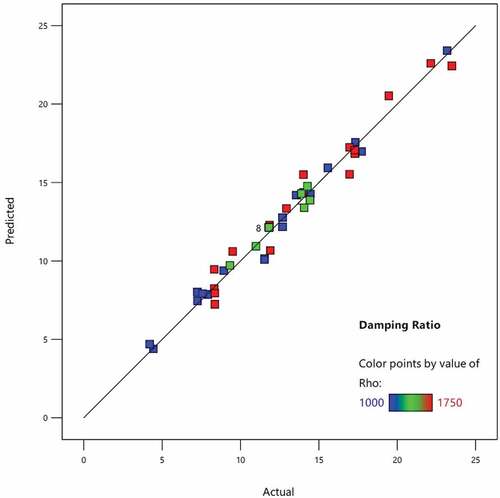
Figure 6. Damping ratio model.
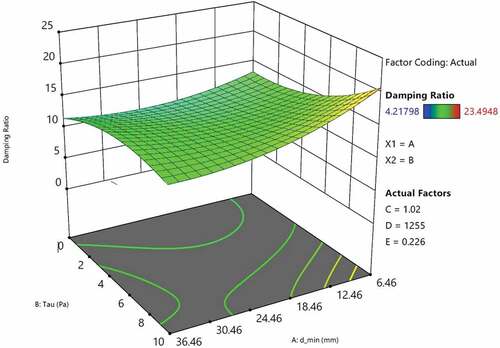
Table 3. ANOVA for reduced cubic model.
Figure 7. Drag force: predicted vs. actual.
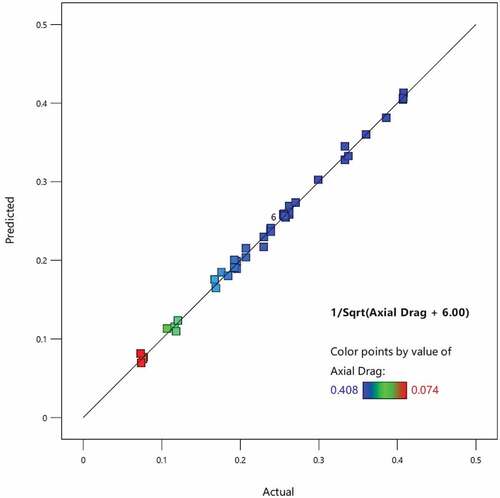
Figure 8. Axial drag model.
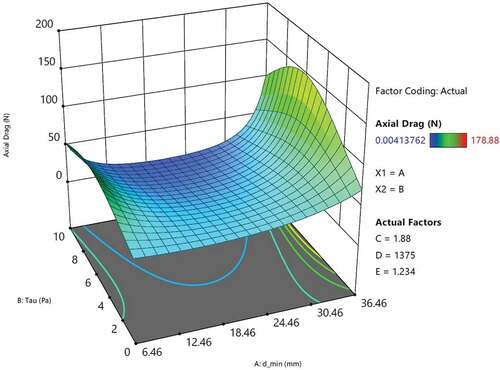
Figure 9. The 3D CAD model of the apparatus.
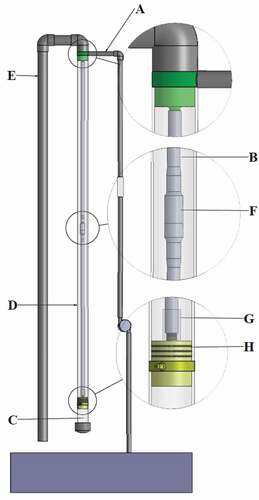
Figure 10. Experimental apparatus and equipment used.
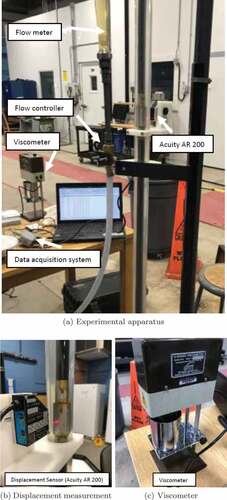
Figure 11. Sample experimental data.
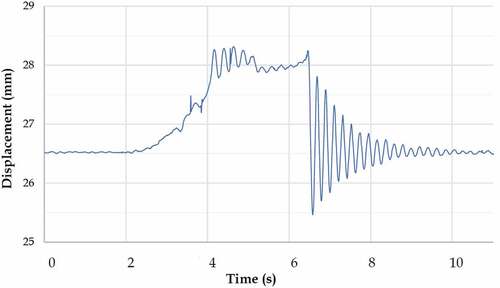
Figure 12. Damping ratio change in Newtonian fluid.
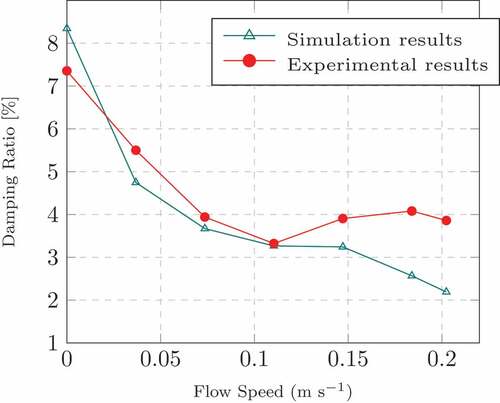
Figure 13. Viscometer test results of the non-Newtonian fluid.
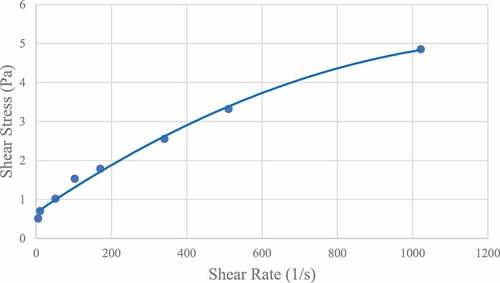
Figure 14. Damping ratio change in non-Newtonian fluid.
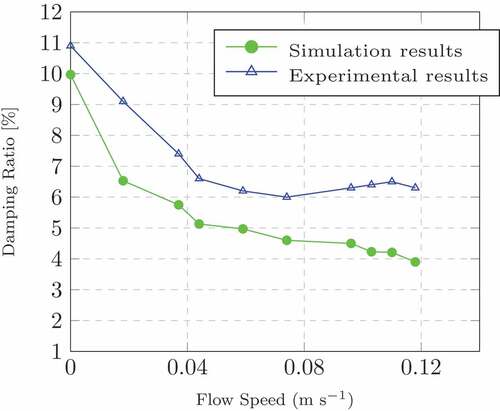
Figure 15. 3D bond graph element.
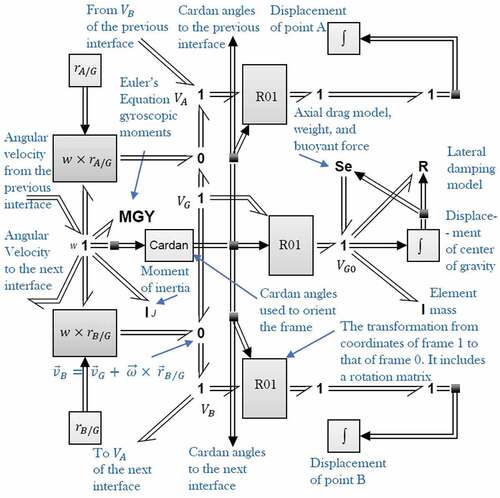
Figure 16. Interface between elements.
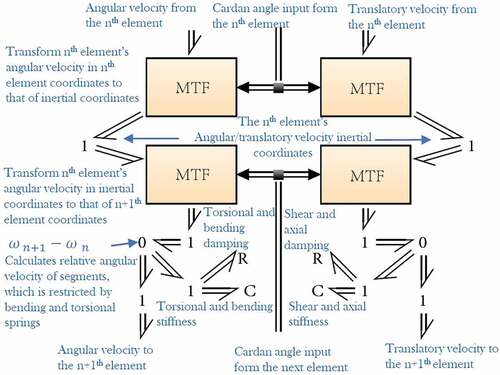
Figure 17. BG element compliances.
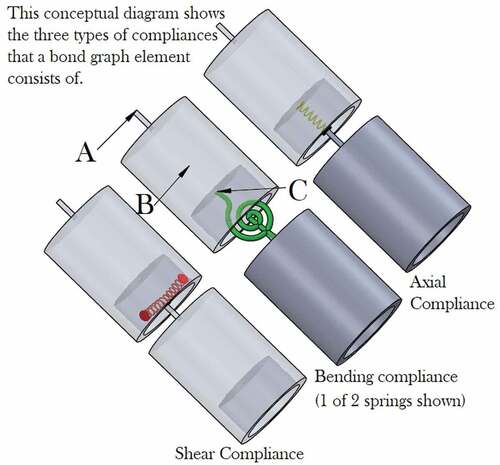
Figure 18. Contact spring schematic [Citation10].
![Figure 18. Contact spring schematic [Citation10].](/cms/asset/dc816270-fbb2-4d27-b742-678861a50726/nmcm_a_2143531_f0018_oc.jpg)
Figure 19. Bending moment fluctuation.
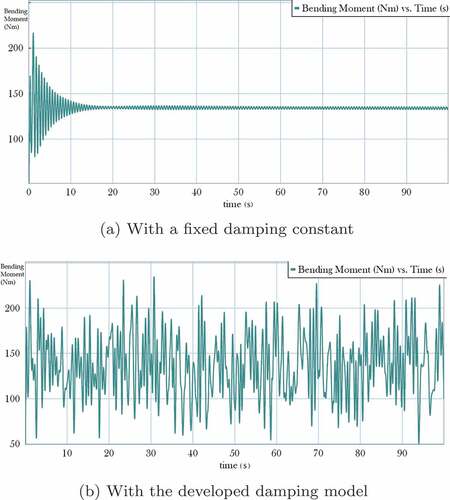
Figure 20. Drill string’s apparent weight fluctuation.
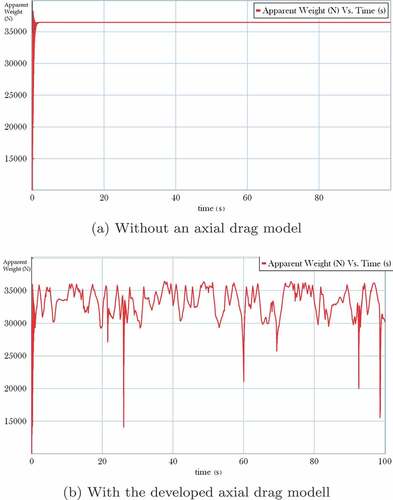
Figure 21. Natural frequency vs. fluid velocity.
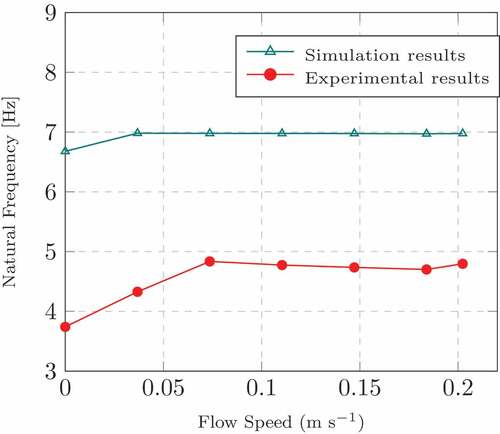
Figure 22. Radius ratio vs. Reynolds number.[Citation40]
![Figure 22. Radius ratio vs. Reynolds number.[Citation40]](/cms/asset/e57476dc-d38c-4fa7-b73a-24591eb6917f/nmcm_a_2143531_f0022_oc.jpg)
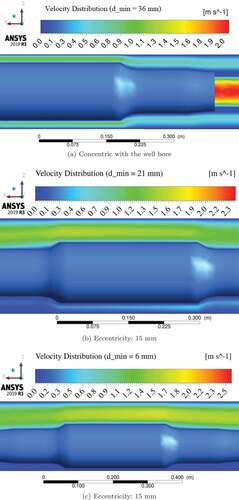
Figure 23. Velocity distribution with the changing eccentricity (Figures illustrate the change in maximum velocity with increasing eccentricity).