Figures & data
Figure 1. Main components of the considered hot-dip galvanizing line.
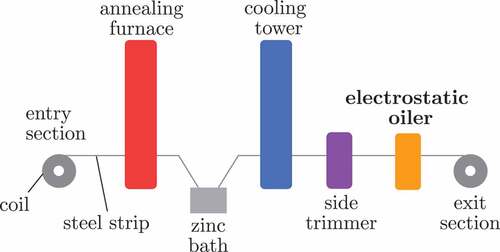
Figure 2. Electrostatic oiling machine. (a) Cross section. (b) Front view of the electrostatic oiling blades.
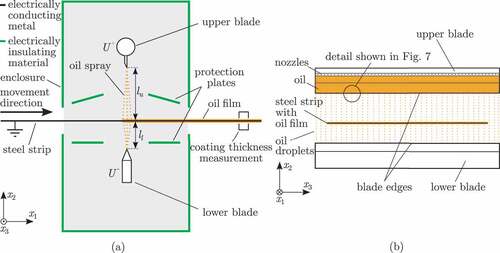
Figure 3. Cross section of the oiling blades.
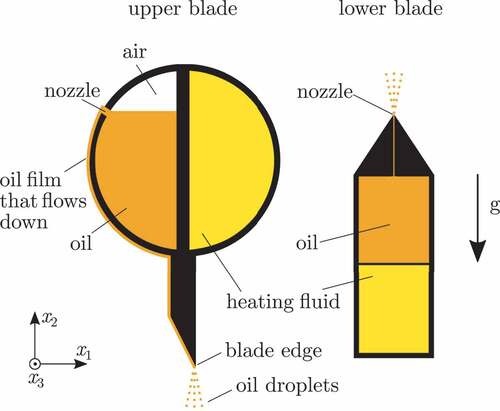
Figure 4. Block diagram of the model.
Figure 5. Flow chart of the numerical model implemented in ANSYS Fluent.
Figure 6. Photograph of the oil spray at the upper blade (lateral view, captured through inspection window of the EOM) with detail showing the measurement of the droplet velocity and diameter, scale: 1px 28 μm.
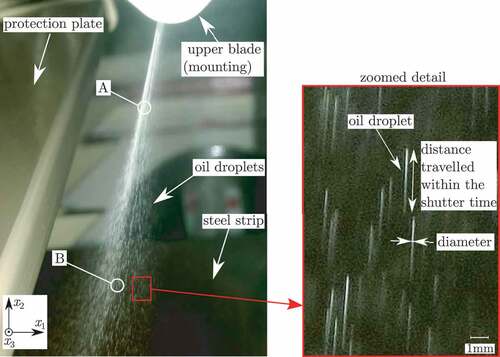
Figure 7. Atomization process at the blade edge (detail from )).
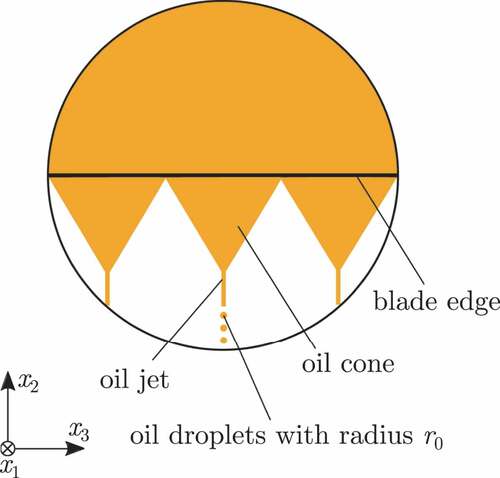
Table 1. Operating points for the parameter identification, ,
, and
.
Figure 8. Simulation results for ,
,
, and
. (a) Droplet radii. (b) Droplet velocities.
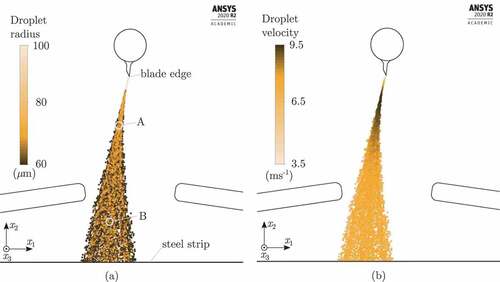
Table 2. Comparison of (simulated) forces per unit mass acting on the droplets, positions defined in ).
Table 3. Comparison of measured and simulated absolute (mean) droplet velocities ,
and (mean) droplet radii
,
at the positions A and B, respectively,
,
, and
.
Figure 9. Simulation results without a break-up model for ,
,
, and
. (a) Droplet radii. (b) Droplet velocities.
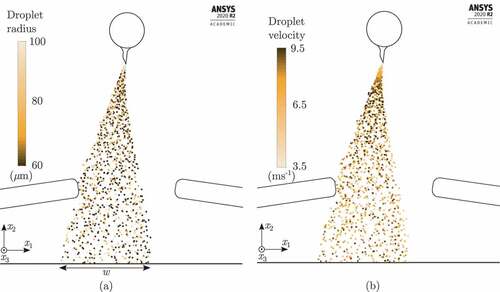
Table 4. Simulated absolute (mean) droplet velocities ,
and (mean) droplet radii
,
at the positions A and B, respectively, without a break-up model and
,
, and
.
Table 5. Comparison of calculated droplet radius limits according to (15) (for K = 0.7) with measured and simulated (mean) droplet radii at position B,
,
, and
.
Figure 10. Simulated electric field strength (log scale) for ,
,
, and
.
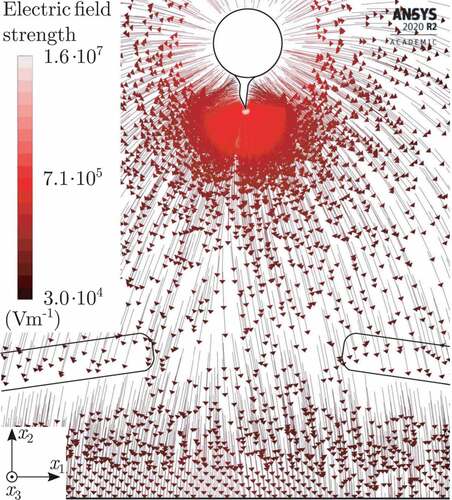
Figure 11. Simulated droplet radii for ,
,
, and
.
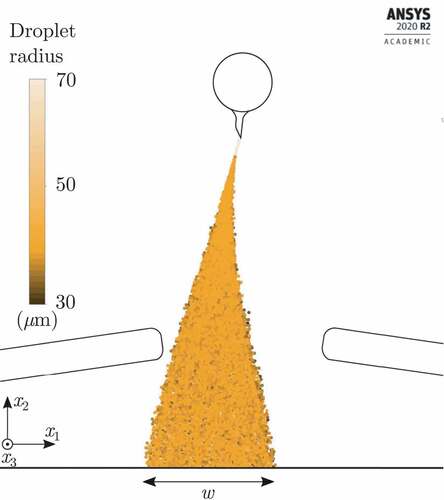
Figure 12. Simulation results for ,
,
, and
. (a) Air flow velocity. (b) Droplet velocities.
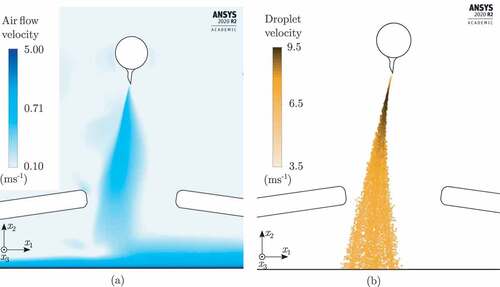
Table 6. Dependence of the output variables on the input variables.
Figure 13. Laterally inclined upper blade.
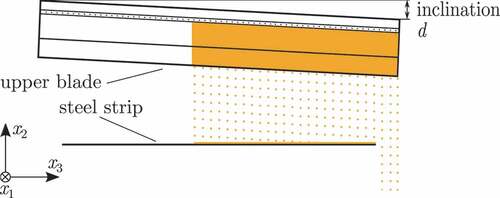
Figure 14. Reduced unused air volume in the rotated upper blade.
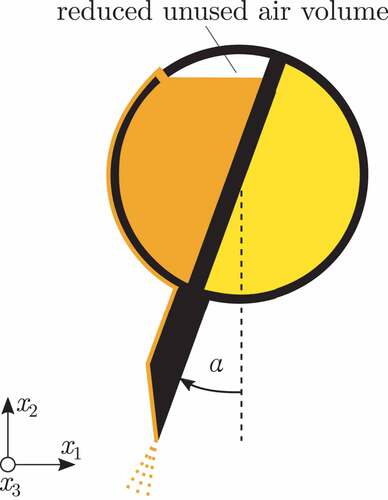
Figure 15. Simulated droplet radii for ,
,
,
,
,
, and
.
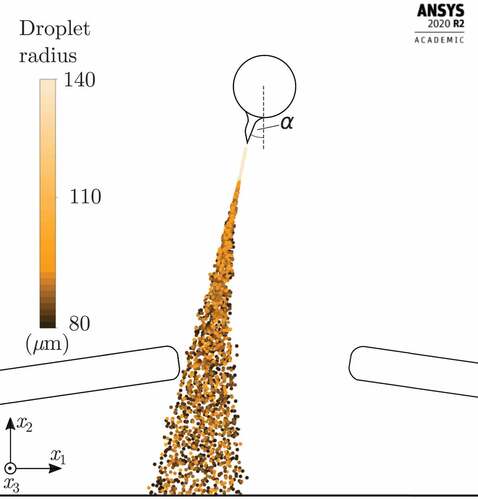
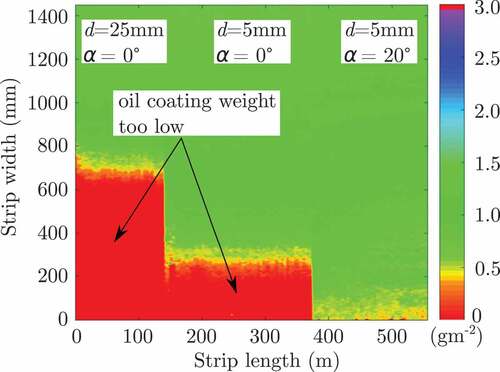
Figure 16. Measured oil coating weight on the upper strip surface for ,
,
,
,
, and
.