Figures & data
Figure 1. Sparsity patterns of exemplary full-order matrices and of the matrices
of its associated proper subsystem.
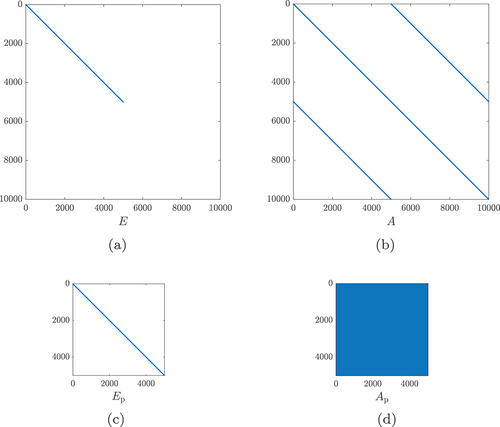
Table 1. Proposed tangential interpolation methods for pH-DAEs. The six different categories are derived from the original system’s Kronecker index and whether its transfer function has improper parts.
Figure 2. Structure of the RCL ladder networks modelled by RCL-1M and RCL-12S.
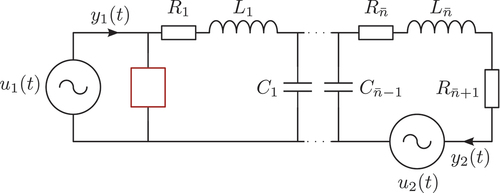
Figure 3. Model parameters and sigma plots for the RCL ladder network models RCL-1M and RCL-12S in pH-DAE staircase form.
Figure 4. Reduction of the model RCL-1M to order using different interpolatory MOR methods. Given are the sigma plots of the FOM and ROMs (left) and of the respective error systems (right).
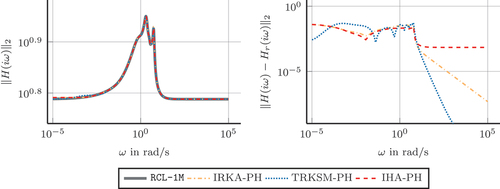
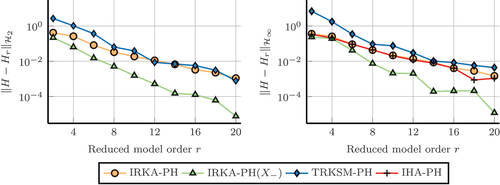
Figure 5. Reduction of the model RCL-12S to different reduced orders . Plotted are the
errors (left) and
errors (right) for different interpolatory MOR methods.