Figures & data
Figure 1. Bionic soft arm, source: Festo SE & Co. KG. The m long continuum manipulator is actuated pneumatically by four bellows segments and three rotary drives.
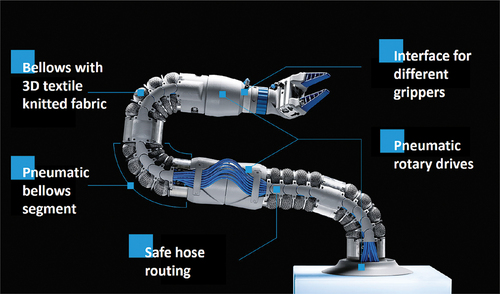
Figure 2. Detailed view of a bellows segment, source: Festo SE & Co. KG. Three aluminium ribs are shown, which divide the bellows chain into four interconnected bellows.
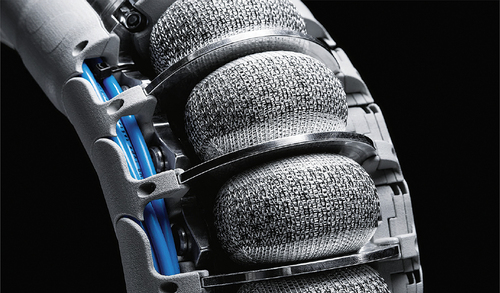
Figure 3. Mechanics of the bionic soft arm, where ,
,
are the rotation angles of the rotary drives and
,
,
,
are the bending angles of the bellows segments. The gripper is located at the tool-centre-point of the bionic soft arm.
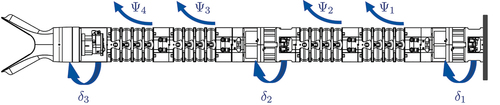
Figure 4. Construction of a bellows segment.
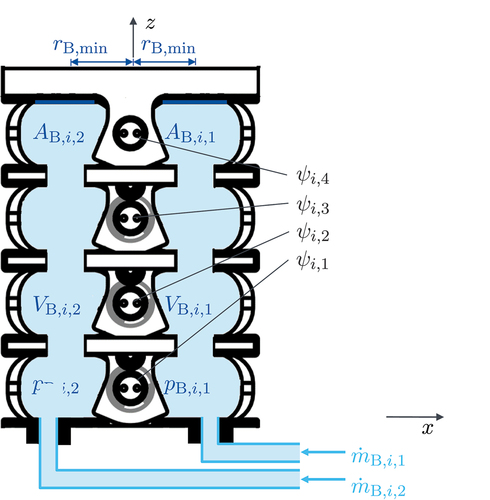
Figure 5. Construction of a bellows chain. The area which connects the bellows to the frame is coloured blue in the upper subfigure.
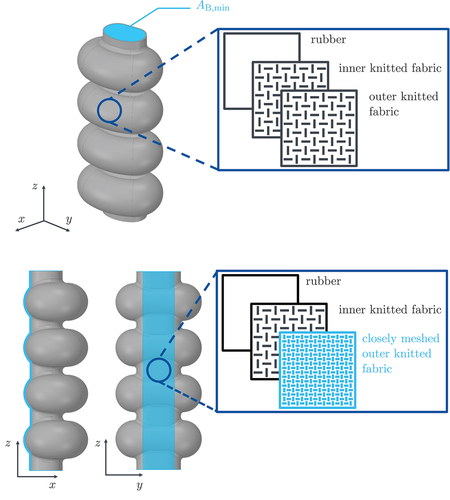
Figure 6. A bellows chain at different absolute pressure levels. The subfigures show different pressure levels and the resulting curvatures of the bellows chain. The bellows’ volume increases when the pressure rises.
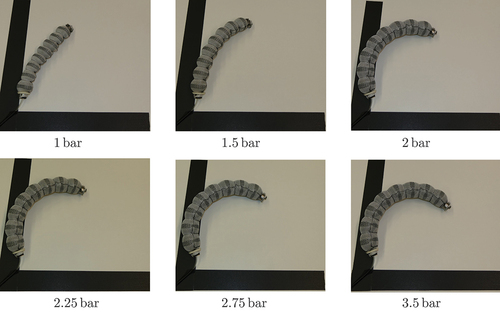
Figure 7. Sketch of the two-dimensional no-slip membrane contact between bellows and ribs.
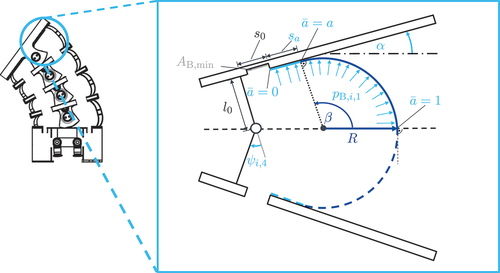
Figure 8. Stress–strain curve of the bellows. The correlation between the material stress and the material strain of the identified ogden model is shown.
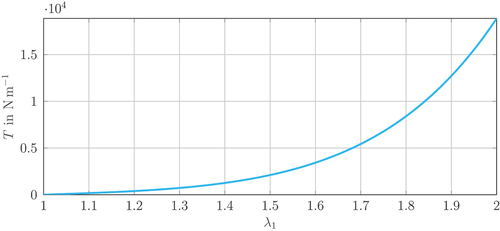
Figure 9. Infinitesimal material stresses arising due to pressure.
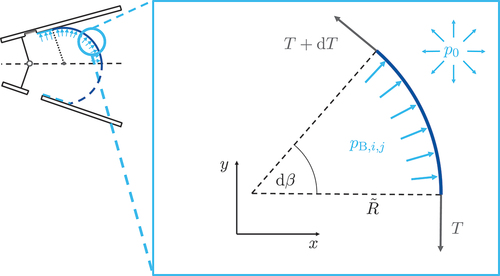
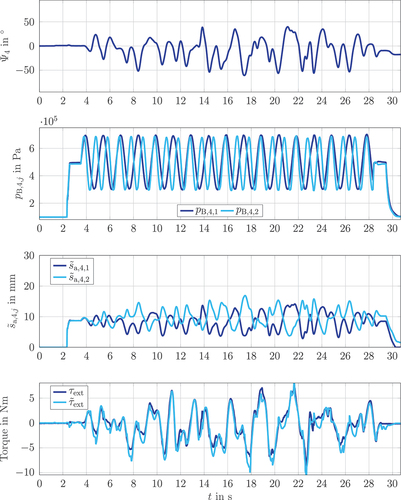
Figure 10. High dynamic validation of the bellows’ driving torque model. The angle , the pressure
and the approximated membrane contact length
are exemplarily shown for the fourth bellows segment. The measured external torque
and the estimated external torque
are also illustrated. The pressure in the bellows is set by a pressure controller and the position is applied to the system by an external force.
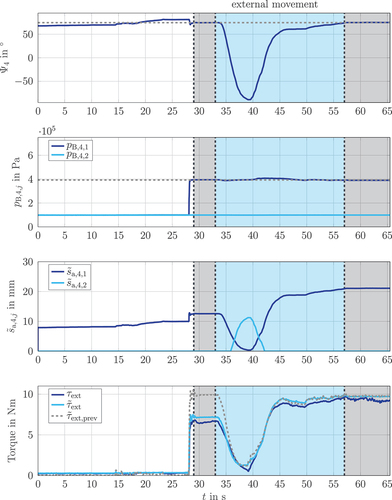
Figure 11. Material behaviour of the first bellows chain of the fourth bellows segment. For the pressurized bellows from , the time course of the strain of the free material and the transition point
as well as the strain profile are shown. In addition,
is also drawn in grey in the strain profile. The strain of the free material
after the ventilation of the bellows at
as well as the additional strain due to the stretching of the bellows between
and
, caused by the externally imposed movement of the bellows segment, are illustrated.
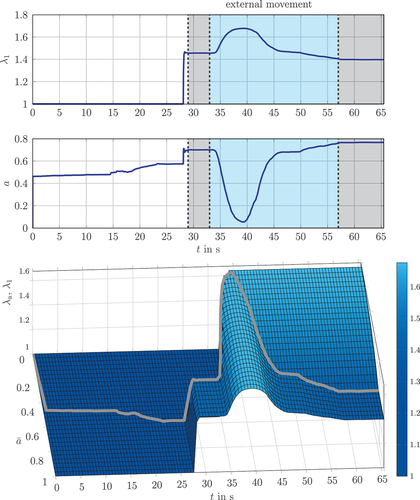
Figure 12. High dynamic validation of the bellows’ driving torque model. The angle , the pressure
and the approximated membrane contact length
are exemplarily shown for the fourth bellows segment. The measured external torque
and the estimated external torque
are also illustrated. The pressure in the bellows is set by a pressure controller and the position is applied to the system by an external force.