Figures & data
Table 1. Bond graph elements
Figure 1. Discetized drill string segments are connected together with axial, torsional, and bending springs (all are included simultaneously).
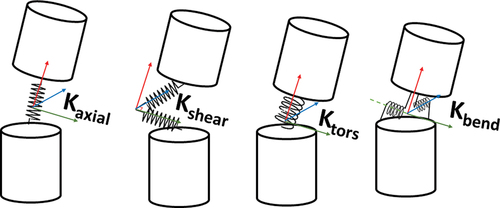
Figure 2. BG formulation of 3D rigid drill string MBD segment (Rideout et al. Citation20131984).
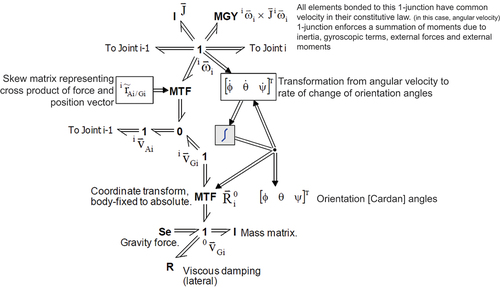
Figure 3. Test cylinder and the test point used in the 3D contact algorithm.
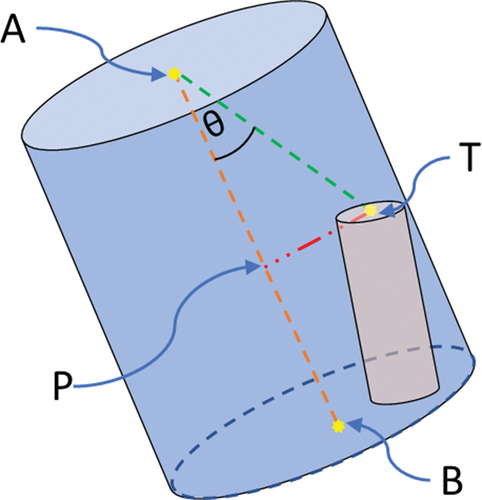
Figure 4. When drill string endpoint is located at the top or bottom of the wellbore cylinder.
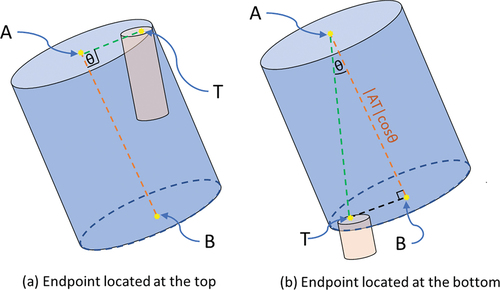
Figure 5. Arbitrary vector going through test point (T) and point in cylinder axis (S).
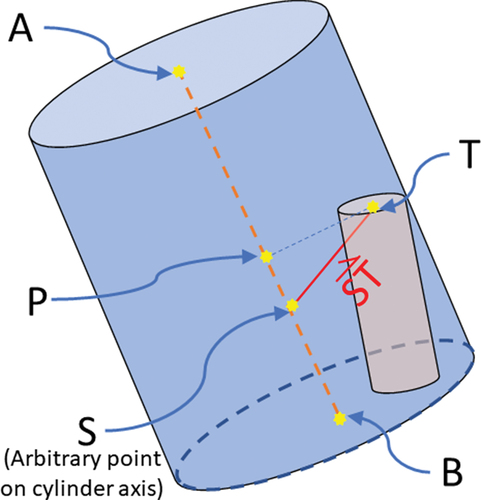
Figure 6. BG model of the drill string with the contact algorithm.
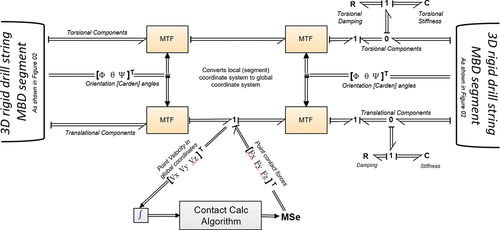
Figure 7. Summary of contact calculation algorithm.
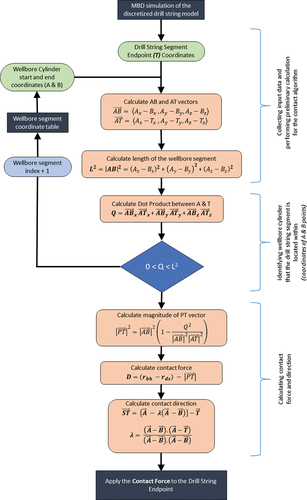
Table 2. Sample well profile calculation in cartesian coordinates.
Figure 8. The gap between wellbore cylinders and overlap.
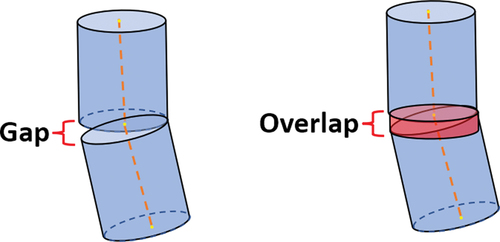
Figure 9. Comparision of contact force between FEA and FCTD models.
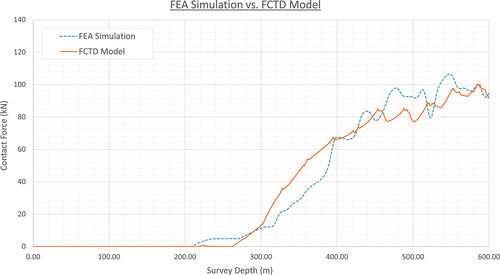
Figure 10. Comparision of horizontal displacement between FEA and FCTD models.
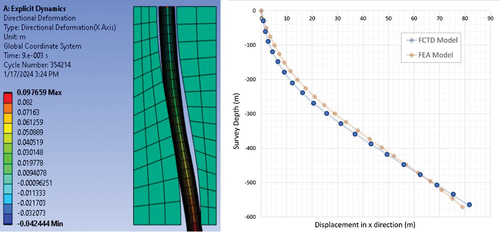
Figure 11. Deviated well profile used for validation.
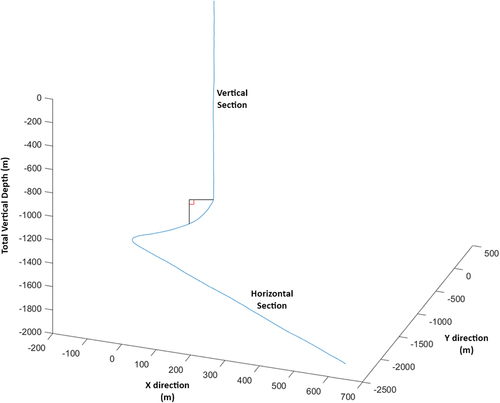
Figure 12. Off-bottom torque comparison between measured vs. simulated.
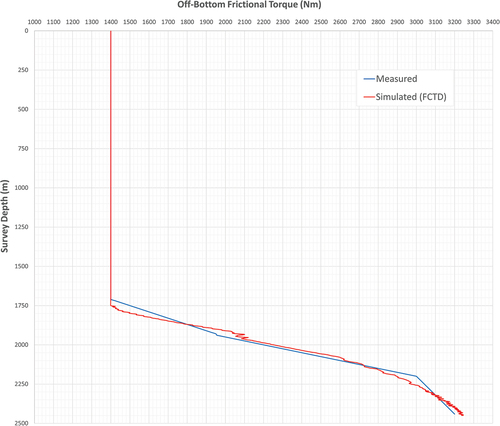
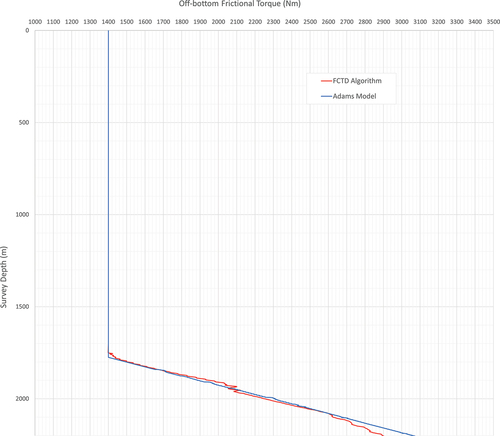
Figure 13. Comparision of torque predictions between FCTD andMSC Adams® contact alogirthms.