
Figures & data
Figure 1. of
,
,
and
for
.
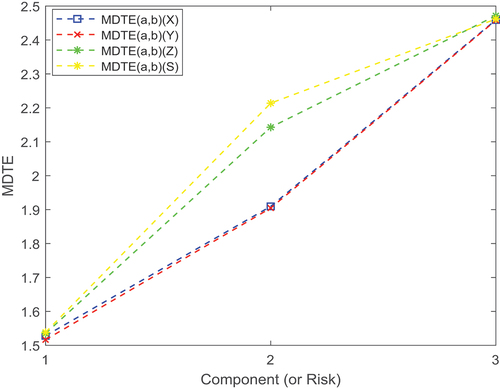
Figure 2. The trace plots of the Monte Carlo estimates of the elements of μ
(
(left) and
(right)).
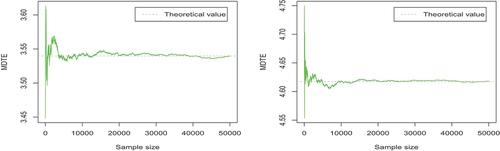
Figure 3. The trace plots of the Monte Carlo estimates of the three elements of Σ (
(left),
(center) and
(right)).
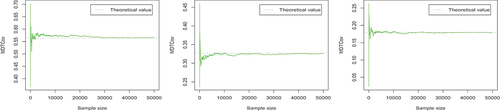
Figure 4. The trace plots of the Monte Carlo estimates of the elements of μ
(
(left) and
(right)).
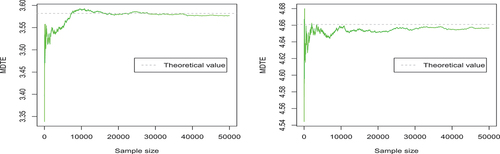
Figure 5. The trace plots of the Monte Carlo estimates of the three elements of (
(left),
(center) and
(right)).
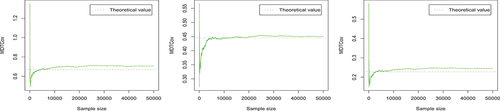
Figure 6. The trace plots of the Monte Carlo estimates of the elements of μ
(
(left) and
(right)).
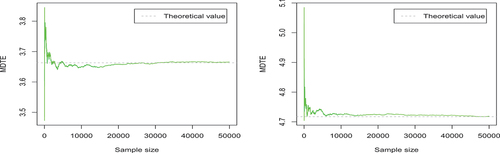
Figure 7. The trace plots of the Monte Carlo estimates of the three elements of Σ (
(left),
(center) and
(right)).
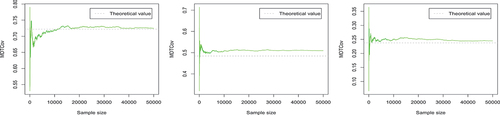
Figure 8. The trace plots of the Monte Carlo estimates of the elements of μ
(
(left) and
(right)).
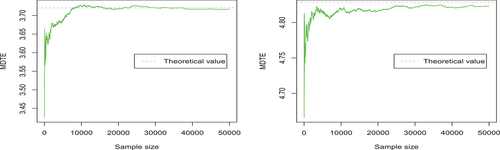
Figure 9. The trace plots of the Monte Carlo estimates of the three elements of Σ (
(left),
(center) and
(right)).
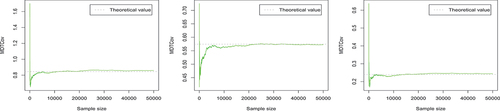
Table 1. Fitted distributions and their information criterion values to the logarithm of adjusted prices of different sectors.
Figure 10. PP plot for the skew-normal distribution for the logarithm of adjusted prices of companies in the financials (left) and energy sectors (right).
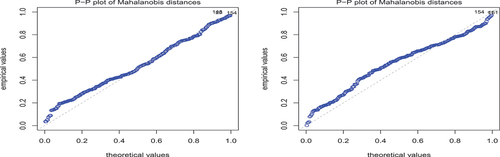
Figure 11. Bivariate scatter plots with contour lines for the skew-normal distribution for the logarithm of adjusted prices of companies in the financials (left) and energy sectors (right).
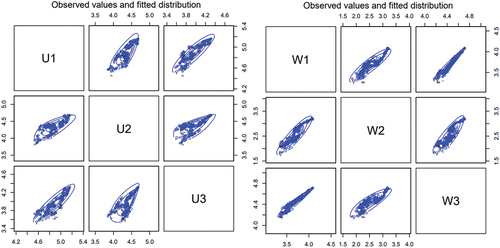
Table 2. The VaRs of and
for
.
Table 3. The MTCEs of and
for
.