616
Views
6
CrossRef citations to date
0
Altmetric
Research Article

Wound Healing Properties of Triterpenes from Buddleia scordioides in Diabetic Rats

&
Pages 647-653 | Accepted 31 Jan 2008, Published online: 20 Oct 2008

Figures & data

Scheme 1 Structures of compounds 1 and 2.

Scheme 1  Structures of compounds 1 and 2.

Figure 1 Wound healing properties of compounds 1 and 2 and tensile strength of the wound in diabetic rats after 7 days. Values are mean + S.E. (n = 10 animals). *P < 0.05 and ** P < 0.01 as compared to vehicle (water) control. All wound area measurements were expressed as a percentage of the initial wound size.
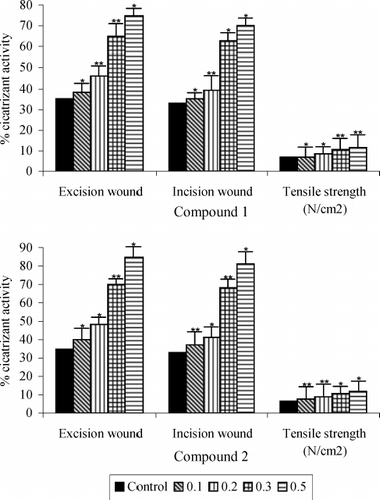
Figure 1  Wound healing properties of compounds 1 and 2 and tensile strength of the wound in diabetic rats after 7 days. Values are mean + S.E. (n = 10 animals). *P < 0.05 and ** P < 0.01 as compared to vehicle (water) control. All wound area measurements were expressed as a percentage of the initial wound size.

Figure 2 Collagen content of saponins 1 and 2 treated and untreated wound granulation tissue from diabetic rats. Data are given as mean + S.E. for eight animals in each group. Statistically significant results are indicated as *P < 0.001 and **P < 0.01.
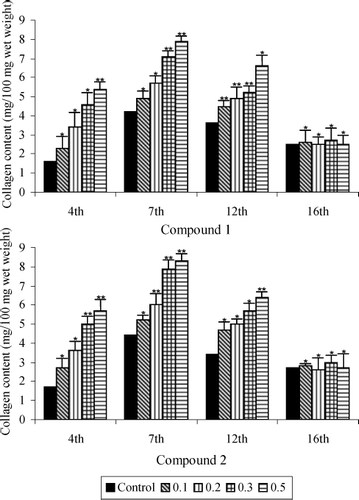
Figure 2  Collagen content of saponins 1 and 2 treated and untreated wound granulation tissue from diabetic rats. Data are given as mean + S.E. for eight animals in each group. Statistically significant results are indicated as *P < 0.001 and **P < 0.01.
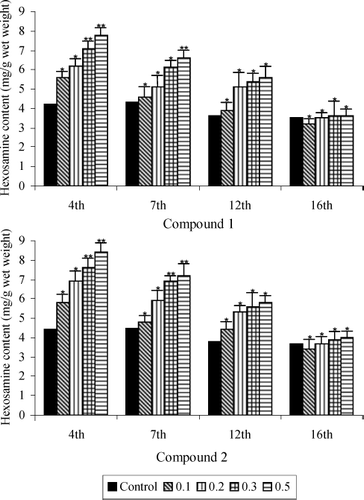
Figure 3 Hexosamine content of saponins 1 and 2 treated and untreated wound granulation tissue from diabetic rats. Data are given as mean + S.E. for eight animals in each group. Statistically significant results are indicated as *P < 0.001 and **P < 0.01.
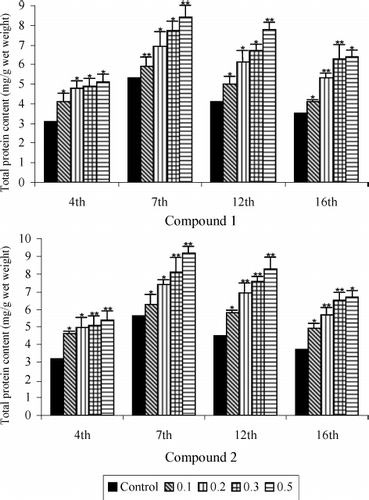
Figure 3  Hexosamine content of saponins 1 and 2 treated and untreated wound granulation tissue from diabetic rats. Data are given as mean + S.E. for eight animals in each group. Statistically significant results are indicated as *P < 0.001 and **P < 0.01.
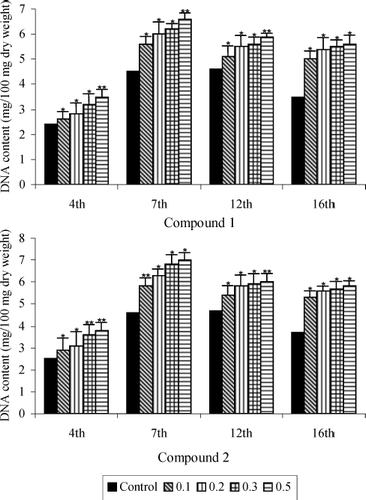
Figure 4 Total protein content of saponins 1 and 2 treated and untreated wound granulation tissue from diabetic rats. Data are given as mean + S.E. for eight animals in each group. Statistically significant results are indicated as *P < 0.001 and **P < 0.01.

Figure 4  Total protein content of saponins 1 and 2 treated and untreated wound granulation tissue from diabetic rats. Data are given as mean + S.E. for eight animals in each group. Statistically significant results are indicated as *P < 0.001 and **P < 0.01.

Figure 5 DNA content of saponins 1 and 2 treated and untreated wound granulation tissue from diabetic rats. Data are given as mean + S.E. for eight animals in each group. Statistically significant results are indicated as *P < 0.001 and **P < 0.01.

Figure 5  DNA content of saponins 1 and 2 treated and untreated wound granulation tissue from diabetic rats. Data are given as mean + S.E. for eight animals in each group. Statistically significant results are indicated as *P < 0.001 and **P < 0.01.

Table 1 Period of ephithelialization of saponins 1 and 2 treated wounds on diabetic rats.

Reprints and Corporate Permissions

Please note: Selecting permissions does not provide access to the full text of the article, please see our help page How do I view content?

To request a reprint or corporate permissions for this article, please click on the relevant link below:

Academic Permissions

Please note: Selecting permissions does not provide access to the full text of the article, please see our help page How do I view content?

Obtain permissions instantly via Rightslink by clicking on the button below:

If you are unable to obtain permissions via Rightslink, please complete and submit this Permissions form. For more information, please visit our Permissions help page.