Figures & data
Figure 1. Diagram of the passageway water maze. Mice were individually placed in the start area (A, B and C) with the head toward the wall during training. They started training from A on day 1, from B on day 2, from C on day 3–5. There are 4 error areas (1, 2, 3 and 4) which are dead ends in the maze. Stair: the underwater stairway is a safe area where the mice can climb out from the water. The maze is filled with water (23 ± 2°C) 10 cm in depth.
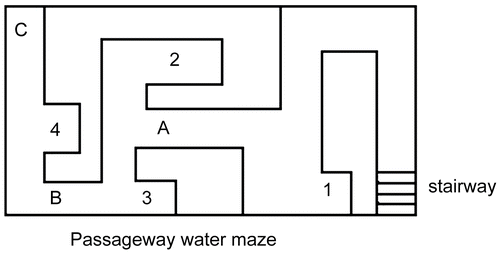
Table 1. The effect of DHA on mouse memory performance in the step-through test. The data show DHA can significantly increase latency time and decrease number of errors by mice in the step-through avoidance test. There was significant difference between the DHA-treatment groups and aged group.
Table 2. The effect of DHA on mouse latency period in the passageway water maze. The data shows DHA can decrease mouse escape latency period in the passageway water maze. From day 4 to day 6, the escape latency period of mice in each group continuously decreased. Moreover, there was significant difference in the escape latency period between the DHA-treatment groups and aged group.
Table 3. The effect of DHA on mouse number of errors in the passageway water maze. DHA can decrease the mouse number of errors in the passageway water maze. For days 4 to 6, there were significant differences between the high dose group and aged group. For days 4 to 5 there were significant differences between the low dose group and aged group, but no significant differences on day 6.
Table 4. The changes in DHA levels in hippocampus, frontal cortex and striatum tissue of mice. In hippocampus, the change of DHA levels is more obvious than in frontal cortex and striatum tissue.
Table 5. The effect of DHA on DA, NE and 5-HT levels in three brain regions in mice.
Table 6. The effect of DHA on NGF and BDNF levels in hippocampus, frontal cortex, and striatum tissue of mice.