771
Views
17
CrossRef citations to date
0
Altmetric
Research Article

Cytotoxic and anti-inflammatory activities of some constituents from the floral buds of Syringa patula

&
Pages 872-877 | Received 09 Apr 2008, Accepted 24 Jul 2008, Published online: 24 Jun 2009

Figures & data

Figure 1. Chemical structures of compounds 1–6 isolated from Syringa patula.

Figure 1.  Chemical structures of compounds 1–6 isolated from Syringa patula.

Figure 2. Cytotoxicity of tested compounds against Hep-G2 cells after treatment for 24 h with different concentrations of β-amyrin acetate (circles), syringaresinol (squares), and oleoside 11-methyl ester (triangles), as estimated by MTT assay. Results are presented as a percentage compared to control cells treated with solvent (mean of four readings ± SD).
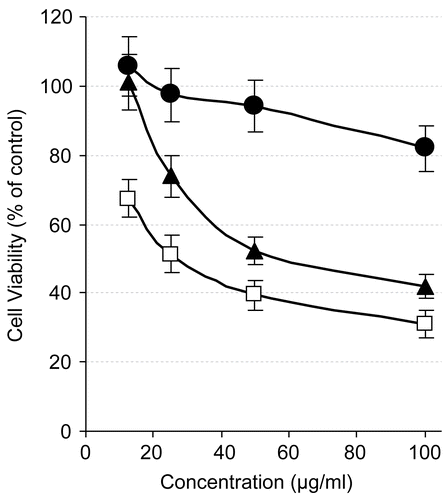
Figure 2.  Cytotoxicity of tested compounds against Hep-G2 cells after treatment for 24 h with different concentrations of β-amyrin acetate (circles), syringaresinol (squares), and oleoside 11-methyl ester (triangles), as estimated by MTT assay. Results are presented as a percentage compared to control cells treated with solvent (mean of four readings ± SD).

Figure 3. Proliferation index of RAW 264.7 cells after treatment with different concentrations of β-amyrin acetate (circles), syringaresinol (squares), and oleoside 11-methyl ester (triangles), as estimated by MTT assay. As described in “Materials and methods”, the proliferation index was calculated relative to control.
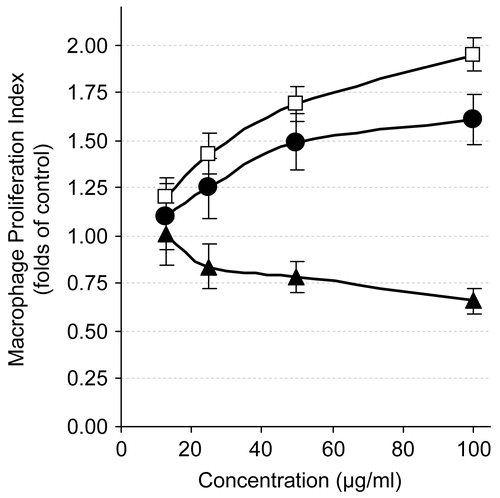
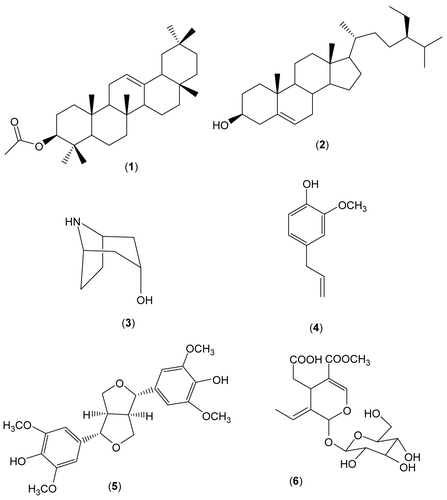
Figure 3.  Proliferation index of RAW 264.7 cells after treatment with different concentrations of β-amyrin acetate (circles), syringaresinol (squares), and oleoside 11-methyl ester (triangles), as estimated by MTT assay. As described in “Materials and methods”, the proliferation index was calculated relative to control.
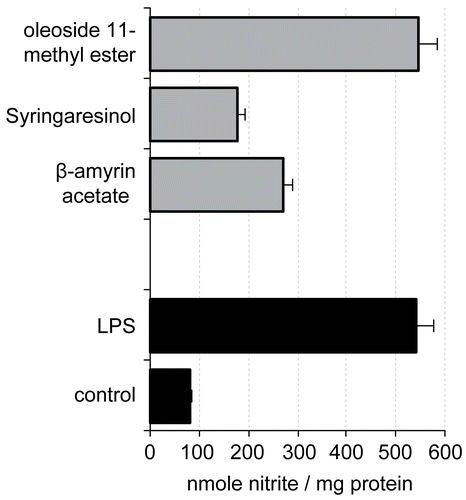
Figure 4. Evaluation of nitrite production (nmol nitrite/mg cellular protein, mean ± SD) by RAW 264.7 cells stimulated for 20 h by LPS (1 μg/mL) alone or in combination with 20 μg/mL of the different compounds.

Figure 4.  Evaluation of nitrite production (nmol nitrite/mg cellular protein, mean ± SD) by RAW 264.7 cells stimulated for 20 h by LPS (1 μg/mL) alone or in combination with 20 μg/mL of the different compounds.

Reprints and Corporate Permissions

Please note: Selecting permissions does not provide access to the full text of the article, please see our help page How do I view content?

To request a reprint or corporate permissions for this article, please click on the relevant link below:

Academic Permissions

Please note: Selecting permissions does not provide access to the full text of the article, please see our help page How do I view content?

Obtain permissions instantly via Rightslink by clicking on the button below:

If you are unable to obtain permissions via Rightslink, please complete and submit this Permissions form. For more information, please visit our Permissions help page.