Figures & data
Figure 1. High performance liquid chromatography – photodiode array detector (HPLC-PDA) profiles of the EDE traced at 190–700 nm. (A), (B) and (C) are spectra obtained by UV spectrometry of bands identified as polyphenols, such as flavonoids and tannins, corresponding to bands 1, 2 and 3, respectively. (D) A profile traced at 190–700 nm.
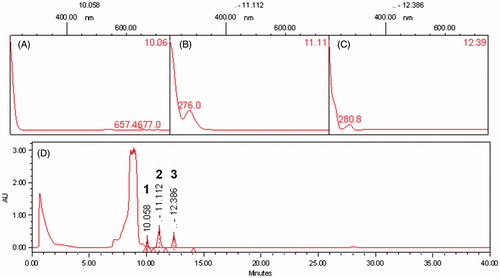
Figure 2. Effect of EDE on Cr(VI) chelating. Amounts of EDE (0–5000 μg) were incubated with Cr(VI) (50 nmol). NAC (200 μg) was used as positive control. Each bar presents mean ± SD of three independent experiments in triplicate (***p < 0.001 versus the control group; ###p < 0.01 versus EDE (20–625 μg); ^p < 0.05 versus EDE (1250 μg); and +++p < 0.001 versus NAC. One-way ANOVA and Bonferroni’s test, p < 0.05).
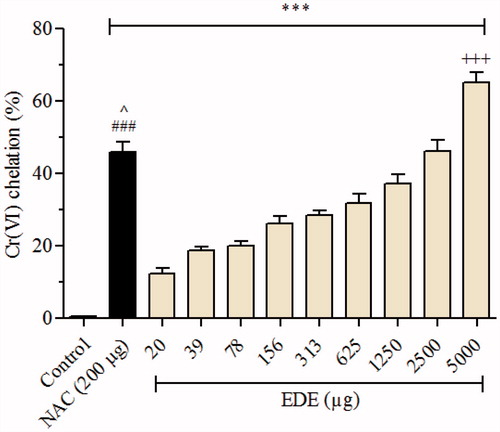
Figure 3. Effect of EDE and Cr(VI) on cell viability of AMJ2-C11 cells. The viability of cells pretreated with or without the extract for 1 h and exposed to Cr(VI) for 6 h was assessed using MTT assay. Experiments are mean ± SD of three independent experiments in six repetitions. Each bar presents mean ± SD of three independent experiments (***p < 0.001 versus the control group and ##p < 0.01 versus Cr(VI). One-way ANOVA and Bonferroni’s test, p < 0.05).
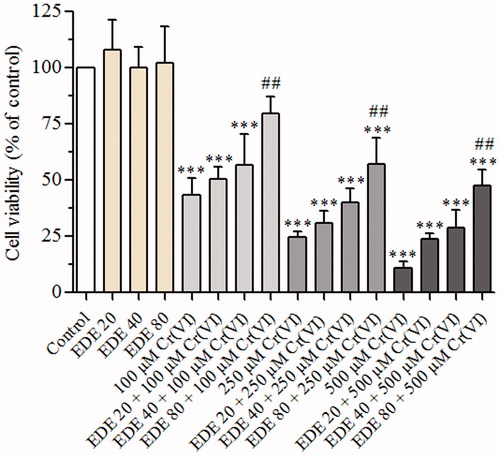
Figure 4. Morphological changes of AMJ2-C11 cells using May–Grünwald–Giemsa dye. The cells were pretreated with or without the extract for 1 h, exposed to Cr(VI) for 6 h and the images were taken using a 100 × objective. (A) Control cells, (B) 100 μM Cr(VI), (C) 250 μM Cr(VI), (D) 500 μM Cr(VI), (E) EDE, (F) EDE + 100 μM Cr(VI), (G) EDE + 250 μM Cr(VI) and (H) EDE + 500 μM Cr(VI).
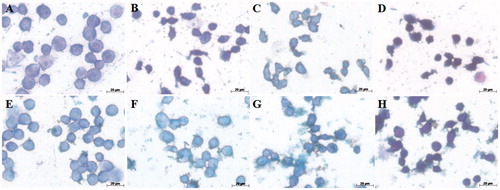
Figure 5. Morphological changes of AMJ2-C11 cells using Hoechst 33258 and apoptosis index. The cells were pretreated with or without the extract for 1 h, exposed to Cr(VI) for 6 h and the images were taken using a 40 × objective. (A) Control cells; (B) 100 μM Cr(VI); (C) 250 μM Cr(VI); (D) 500 μM Cr(VI); (E) EDE; (F) EDE + 100 μM Cr(VI); (G) EDE +250 μM Cr(VI); (H) EDE + 500 μM Cr(VI); (I) apoptosis index (%) for each treatment group (***p < 0.001 versus control; #p < 0.05 and ###p < 0.001 versus Cr(VI). One-way ANOVA and Bonferroni’s test, p < 0.05).
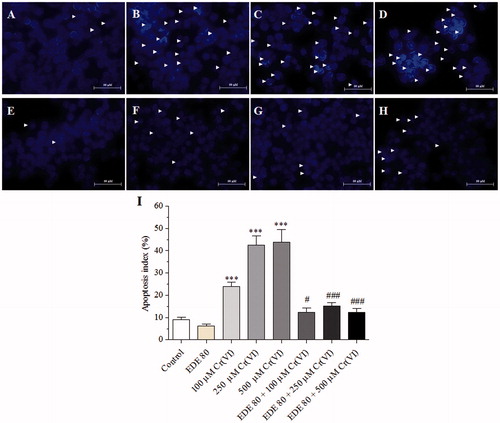
Figure 6. DNA cell cycle analysis. Effects of EDE in the cell cycle progression on AMJ2-C11 cells exposed to Cr(VI).
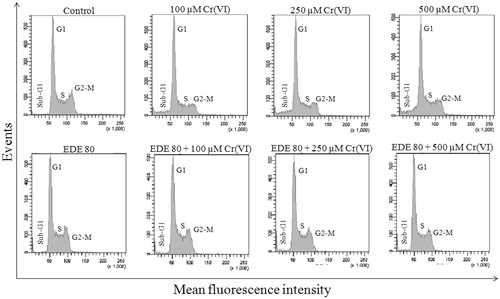
Table 1. Effects of Cr(VI), EDE and EDE + Cr(VI) on cell cycle progression in AMJ2-C11 cells.
Figure 7. Effects of EDE on inhibition of ROS generation and mitochondrial membrane potential in AMJ2-C11 cells exposed to Cr(VI).The cells were pretreated with or without EDE for 1 h followed by exposure to Cr(VI) for 1 h and analyzed using flow cytometer. (A) Cr(VI) increased and EDE inhibited Cr(VI)-mediated ROS production. (B) Cr(VI) altered mitochondrial membrane potential, while the EDE showed a tendency to restore normal mitochondrial membrane potential. Each bar presents mean ± SD of three independent experiments (**p < 0.01 and ***p < 0.001 versus control; #p < 0.05, ##p < 0.01 and ###p < 0.001 versus Cr(VI). One-way ANOVA and Bonferroni’s test, p < 0.05).
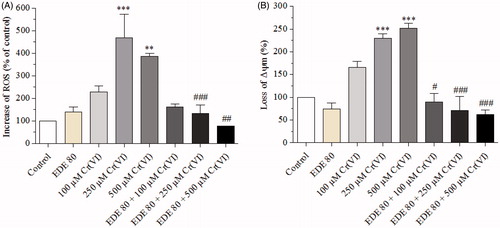
Figure 8. Analysis of phosphatidylserine externalization profile in AMJ2-C11 cells by labelling with annexin V-FITC and PI. The cells were pretreated with or without the extract for 1 h, exposed to Cr(VI) for 6 h and analyzed using a flow cytometer. (A–C) Percentage of dead cells. (D) distribution of necrotic cells in the upper-left quadrant (A−/PI+); early apoptotic cells in the lower-right quadrant (A+/PI−); late apoptotic cells in the upper-right quadrant (A+/PI+); and viable cells in the lower-left quadrant (A−/PI−). Each bar presents mean ± SD of three independent experiments (*p < 0.05, **p < 0.01 and ***p < 0.001 versus control; ##p < 0.01 and ###p < 0.001 versus Cr(VI). One-way ANOVA and Bonferroni’s test, p < 0.05).
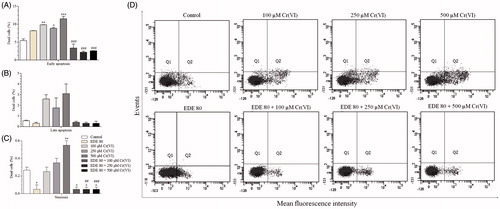
Figure 9. Levels of activate caspases-3/7, -8 and -9. The cells were pretreated with or without the extract for 1 h, exposed to Cr(VI) for 6 h and analyzed using flow cytometer. Each bar presents mean ± SD of three independent experiments (*p < 0.05 and **p < 0.01 versus control; #p < 0.05 versus Cr(VI). One-way ANOVA and Bonferroni’s test, p < 0.05).
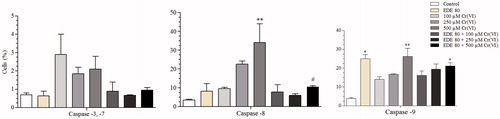
Figure 10. Survival analysis. The mice were pretreated with EDE (50–500 mg/kg/d) for 10 days and exposed to a lethal 50 mg/kg dose of Cr(VI) on the 11th day. The survival rate was monitored until the 31st day (Kaplan–Meier test and Log-Rank test, p < 0.05).
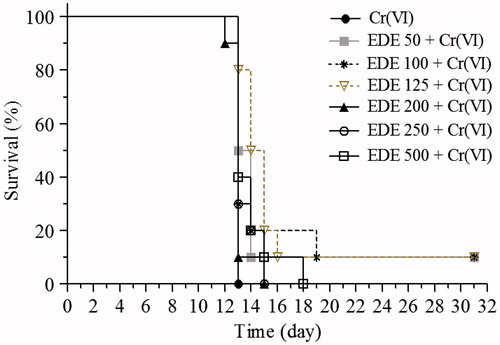
Figure 11. Histopathological analysis of mice liver and kidneys. The mice were pretreated with EDE for 10 days and exposed to a sublethal dose of Cr(VI) on the 11th day. On the 12th day, the animals were euthanized and liver and kidneys were collected for morphological analysis. Kidneys: destruction of the proximal tubules (asterisks), haemorrhagic areas (arrows) and loss of normal structure (head arrow). Liver: haemorrhagic foci (arrows) and necrotic areas (asterisks). Haematoxylin and eosin (H&E), 400×.
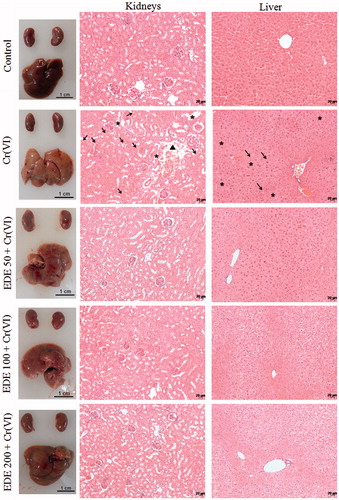
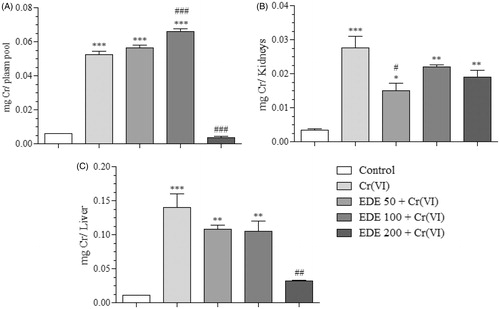
Figure 12. Chromium levels in biological tissues and plasma. Quantification in micrograms of Cr present in each piece of biological material in the treatment groups (A: plasma, B: kidneys, C: liver) (*p < 0.05, **p < 0.001 and ***p < 0.0001 versus control; #p < 0.05, ##p < 0.001 and ###p < 0.0001 versus Cr(VI). ANOVA and Bonferroni’s test, p < 0.05).