Figures & data
Table 1. Summary of primers used in current study.
Table 2. Effect of FME on FBG, plasma insulin and HOMA-IR.
Figure 1. FME protects against glucose intolerance in diabetic rats. (A) Blood glucose level at 0 min, 30 min, 1 h and 2 h after glucose was given at the dosage of 2 g/kg weight. (B) AUC of OGTT. Data were represented as mean ± SD (n = 7). *p <0.05, compared to the NC group; #p <0.05, compared to the DBC group.
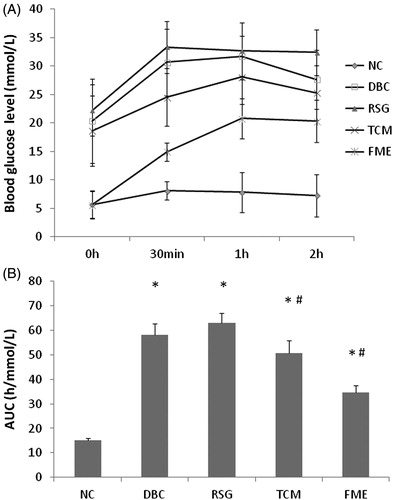
Table 3. Effect of FME on TG, TC, HDL and LDL.
Figure 2. Effect of FME on mRNA expression of IRS-1, PI3K and Glut-4 in skeletal tissue. Data were represented as mean ± SD (n = 7). *p <0.05, compared to the NC group; #P <0.05, compared to the DBC group.
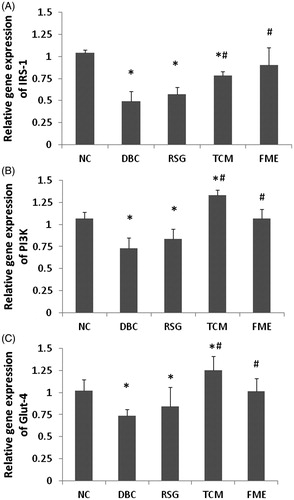
Figure 3. Effect of FME on protein expression in skeletal tissue (A). The relative expression of IRS-1 (B), PI3K (C) and Glut-4 (D) were calculated and were shown, respectively. Data were represented as mean ± SD (n = 7). *p <0.05, compared to the NC group; #p <0.05, compared to the DBC group.
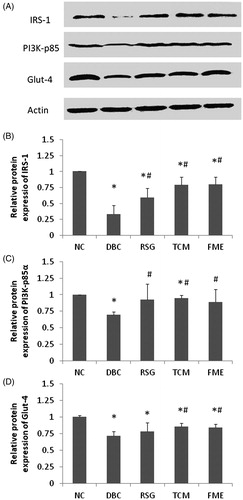
Figure 4. Histological observation of skeletal tissues in experimental rats (HE staining, 40×), (A) NC group, (B) DBC group, (C) RSG group, (D) TCM group and (E) FME group.
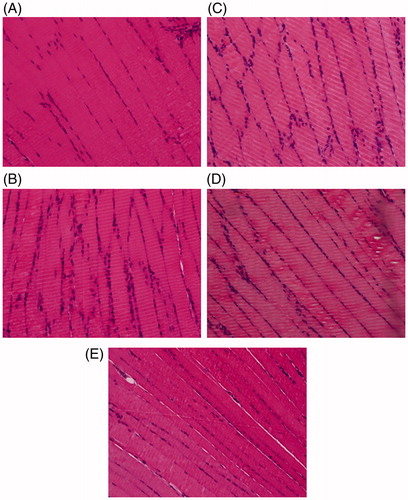
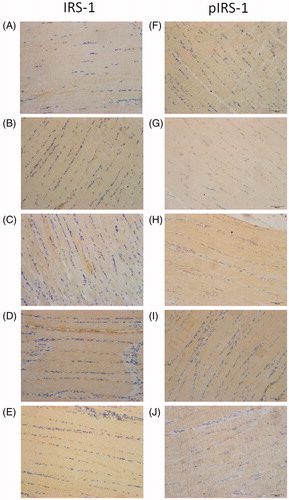
Figure 5. Immunohistochemical staining of skeletal tissues with IRS-1 and pIRS-1 in experimental rats (40× magnification). (A)–(E) represented the staining of IRS-1 in the NC, DBC, RSG, TCM and FME groups, respectively. (F)–(J) represented the staining of pIRS-1 in the NC, DBC, RSG, TCM and FME groups, respectively.