Figures & data
Figure 1. Effect of chrysin on cells viability. (a) Structure of chrysin. (b) The HDF were exposed to 12.5–50 μM chrysin for 36 h. The B16 cells were exposed to 12.5–50 μM chrysin for 24 h. Cells viability was measured by MTT assay. The viability of control cells was defined as 100%. Data are shown as mean ± SD. *p < 0.05 compared to control cells. **p < 0.01 compared to control cells.
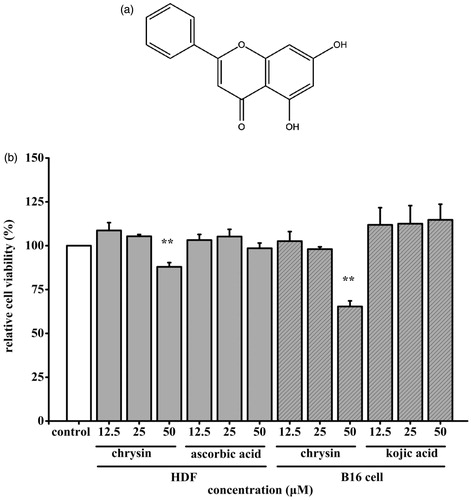
Figure 2. Effects of UVB on HDF cells viability and collagen I production. The HDF cells were exposed to UVB (0–3000 mJ/cm2). (a) HDF cells viability was measured by MTT assay. The viability of control cells was defined as 100%. (b) Amount of collagen I was measured by ELISA kit. Data are shown as mean ± SD. **p < 0.01 compared to control cells.
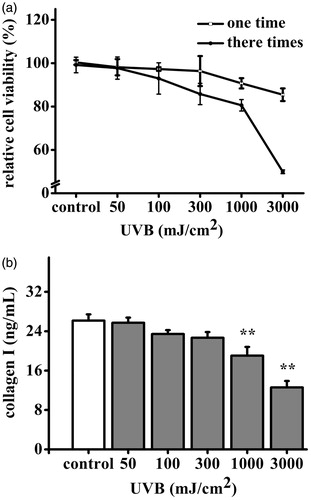
Figure 3. Effect of chrysin on collagen I secretion in UVB induced photoageing HDF. HDF were pre-treated with 6.25–25 μM chrysin and then exposed to UVB (3000 mJ/cm2). Amount of collagen I was measured by ELISA kit. All data are shown as mean ± SD. *p < 0.05 compared to control cells. **p < 0.01 compared to control cells. #p < 0.05 compared to UVB-treated without chrysin cells. ##p < 0.01 compared to UVB-treated without chrysin cells.
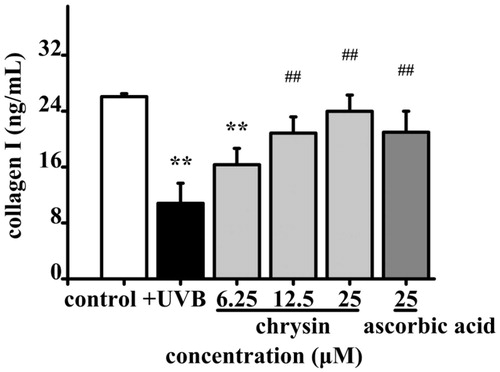
Figure 4. Effects of chrysin on MMP-1, GSH and MDA secretion and SA-β-Gal activity in UVB induced photoageing HDF. HDF were pre-treated with 6.25–25 μM chrysin and then exposed to UVB (3000 mJ/cm2). Amounts of (a) MMP-1, (b) GSH and (c) MDA were measured by kits. (d) and (e) SA-β-Gal activity was observed by staining cells. All data are shown as mean ± SD. *p < 0.05 compared to control cells. **p < 0.01 compared to control cells. #p < 0.05 compared to UVB-treated without chrysin cells. ##p < 0.01 compared to UVB-treated without chrysin cells.
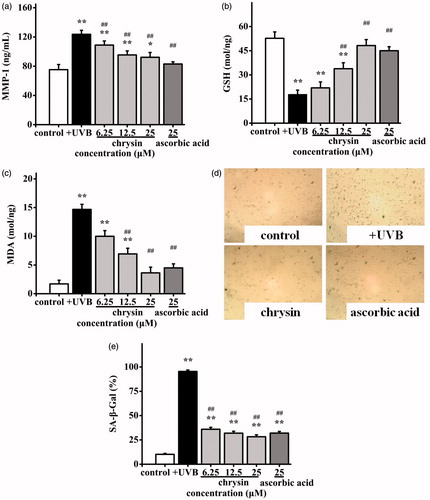
Figure 5. Effect of chrysin on melanin synthesis in B16 cells. B16 cells were incubated with 6.25–25 μM chrysin for 48 h. (a) The melanin contents were observed by staining cells. (b) The melanin content in B16 cells was determined as described. The melanin content of control cells was defined as 100%. Kojic acid was used as the positive control. All data are shown as mean ± SD. *p < 0.05 compared to control cells. **p < 0.01 compared to control cells.
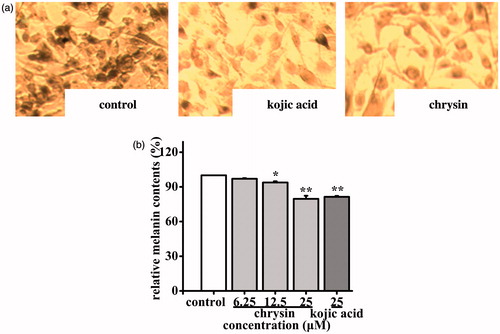
Figure 6. Effects of chrysin on TYR activity in cell-free assay systems and B16 cells. The (a) monophenolase and (b) diphenolase activities of mushroom TYR and (e) TYR activity in B16 cells were determined as described. The TYR activity of control cells was defined as 100%. Kojic acid was used as the positive control. All data are shown as mean ± SD. L-B plots of (c) monophenolase and (d) diphenolase activities of mushroom TYR were determined as described.
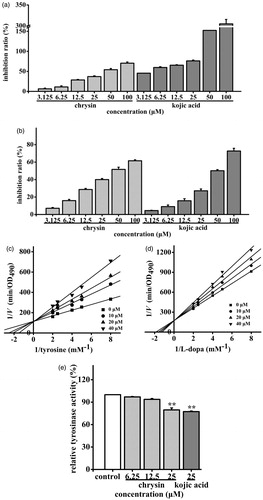
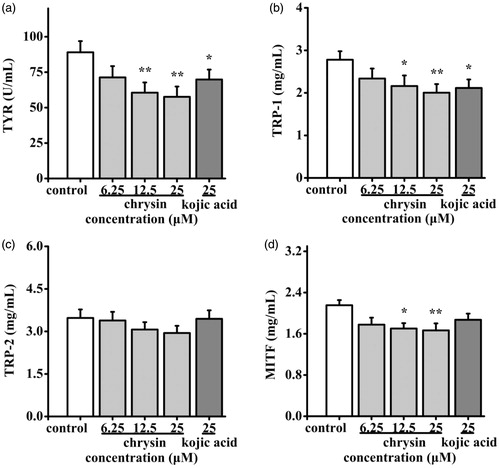
Figure 7. Effect of chrysin on expression of melanogenic proteins in B16 cells. B16 cells were incubated with 6.25–25 μM chrysin for 48 h. Expression levels of (a) TYR, (b) TRP-1, (c) TRP-2 and (d) MITF were measured by ELISA kits. Kojic acid was used as the positive control. All data are shown as mean ± SD. *p < 0.05 compared to control cells. **p < 0.01 compared to control cells.