Figures & data
Figure 1. Effect of the extract on viability of primary human skin fibroblasts. Cells were treated with 0.1% ethanol (control group) or the extract at concentrations in range of 0.5 to 50 μg/mL for 24, 48 and 72 h. Results are expressed as percentage of cell viability as compared to untreated cells for which the optical density was adjusted to 100%. Each bar represents mean ± SD of triplicate study.
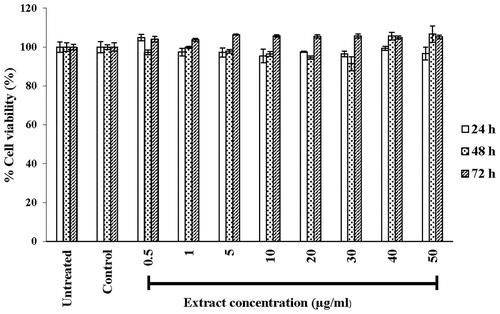
Figure 2. Morphology of primary human skin fibroblasts, untreated cells or treated with 50 μg/mL extract for 72 h at magnification of 10×.
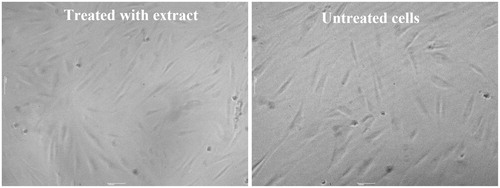
Figure 3. Effects of the extract (50 μg/mL) on type I procollagen (A), MMP-1 (B) and MMP-13 (C) productions by UVB-irradiated human skin fibroblasts at 4 and 24 h after irradiation. Each bar represents mean ± SD of triplicate study. *p <0.05 and **p <0.01, when compared between two groups (Student’s t-test).
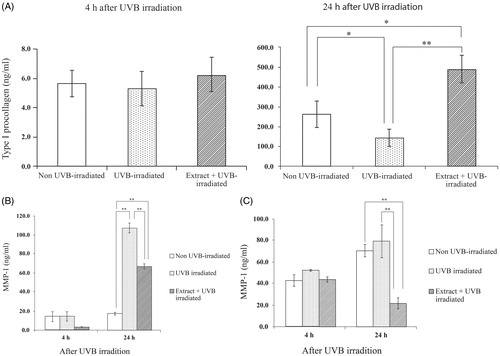
Figure 4. Viability of primary human skin fibroblasts after UVB irradiation for 4 and 24 h. Results are expressed as percentage of cell viability as compared to non-UVB-irradiated group for which the optical density was adjusted to 100%. Each bar represents mean ± SD of triplicate study.
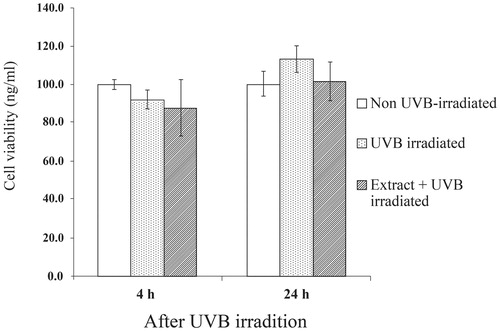
Figure 5. Epidermal thickness of mice skin tissues at 12 weeks after UVB irradiation. Skin was daily applied deionized water, vehicle for extract solution, 3% w/v vitamin C solution or 5% w/v extract solution at 2 h after UVB irradiation. Each bar represents mean ± SD of triplicate study. *p <0.05, when compared between two groups (Student’s t-test).
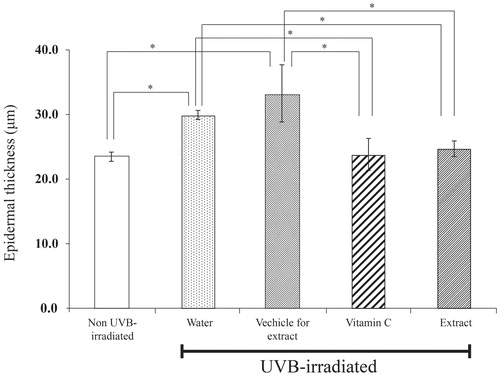
Figure 6. Light microscope (magnification 20×) of 12 week-UVB irradiated mice skin tissues stained with haematoxylin–eosin to show the effects of extract and vitamin C on epidermal thickness.
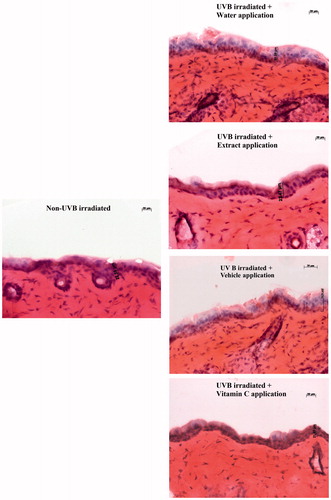
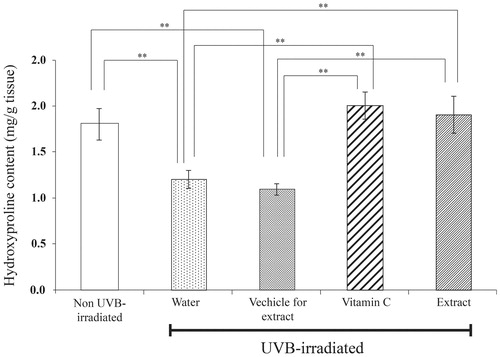
Figure 7. Hydroxyproline content in dermal skin tissues of mice after UVB irradiation for 12 weeks. Skin was daily applied deionized water, vehicle for extract solution, 3% w/v vitamin C solution or 5% w/v extract solution at 2 h after UVB irradiation for 12 weeks. Each bar represents mean ± SD of triplicate study. **p <0.01, when compared between two group (Student’s t-test).