Figures & data
Figure 1. LC-MS profile and chemical structure of 15 β-acetoxy-(-)-kaur-16-en-19-oic acid (xylopic acid).
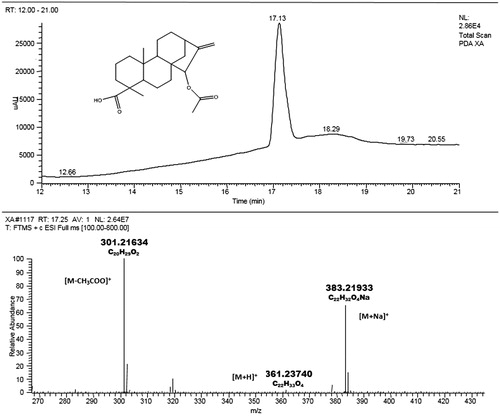
Figure 2. Effect of XAE (30–300 mg/kg p.o), XA (10–100 mg/kg p.o) and morphine (1–10 mg/kg i.p.) on the time course curve of paw withdrawal latency in the Randall–Sellito test (a, b and c) in acute knee pain. The box-and-whisker plots (insets) depict AUCs derived from the respective time course curves. The plots show the 25th and 75th percentiles, the median (horizontal line within the box), and the 10th and 90th percentiles (whiskers). Symbol represents outliers. Data are presented as mean ± S.E.M. (n = 8); ***p < 0.001; **p < 0.01; *p < 0.05 compared to vehicle-treated group (Two-way ANOVA followed by Holm-Sidak’s post hoc test). †††p < 0.001 ††p < 0.01 compared to vehicle-treated group (One-way ANOVA followed by Holm-Sidak’s post hoc test).
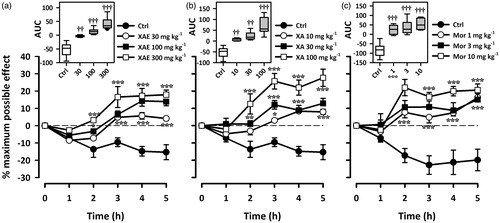
Figure 3. Effect of XAE (30–300 mg/kg p.o.), XA (10–100 mg/kg p.o) and morphine (1–10 mg/kg i.p.) on the time course curve of ipsilateral and contralateral paw (insets) withdrawal latency (a, c and e) and the AUC (b, d and f) in chronic knee pain. Data are presented as mean ± S.E.M. (n = 8); ***p < 0.001; **p < 0.01; *p < 0.05 compared to vehicle-treated group (Two-way ANOVA followed by Holm-Sidak’s post hoc test). †††p < 0.001 †p < 0.05 compared to vehicle-treated group (One-way ANOVA followed by Holm-Sidak’s post hoc test).
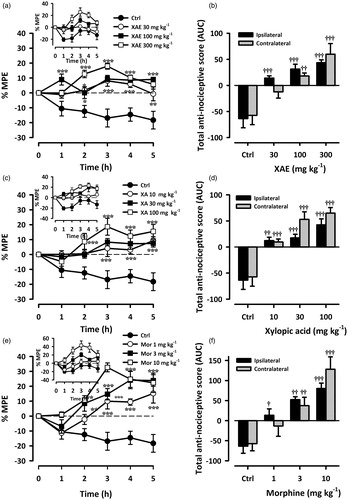
Table 1. Summary of the effect of Xylopia extract, xylopic acid and morphine in acute and chronic musculoskeletal pain in rats.
Figure 4. Effect of XAE (30–300 mg/kg p.o.), XA (10–100 mg/kg p.o.) and morphine (1–10 mg/kg i.p.) on the time course curve of grip strength test (a, c and e) and the AUC (b, d and f) in acute muscle pain. Data are presented as mean ± S.E.M. (n = 8). The box-and-whisker plots (insets) depict AUCs derived from the respective time course curves. The plots show the 25th and 75th percentiles, the median (horizontal line within the box), and the 10th and 90th percentiles (whiskers). ***p < 0.001; **p < 0.01; compared to vehicle-treated group (Two-way ANOVA followed by Holm-Sidak’s post hoc test). †††p < 0.001 compared to vehicle-treated group (One-way ANOVA followed by Holm-Sidak’s post hoc test).
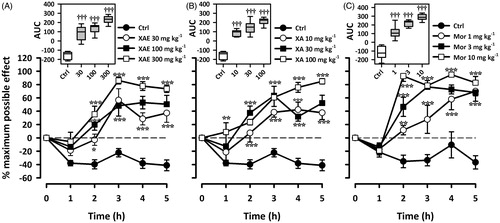
Figure 5. Effect of XAE (30–300 mg/kg p.o.), XA (10–100 mg/kg p.o) and morphine (1–10 mg/kg i.p.) on the time course curve of ipsilateral and contralateral paws (insets) withdrawal latency using the Randall–Sellito test (a, c and e) and the AUC (b, d and f) in chronic muscle pain. Data are presented as mean ± S.E.M. (n = 8); ***p < 0.001; **p < 0.01; *p < 0.05 compared to vehicle-treated group (Two-way ANOVA followed by Holm-Sidak’s post hoc test). †††p < 0.001 †p < 0.05 compared to vehicle-treated group (One-way ANOVA followed by Holm-Sidak’s post hoc test).
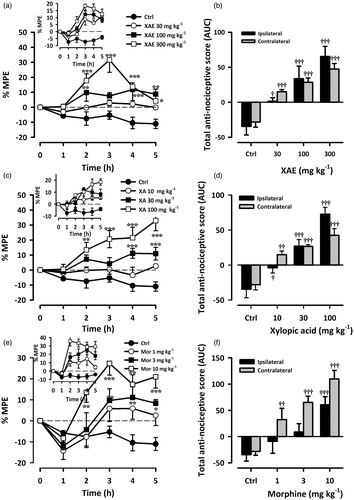
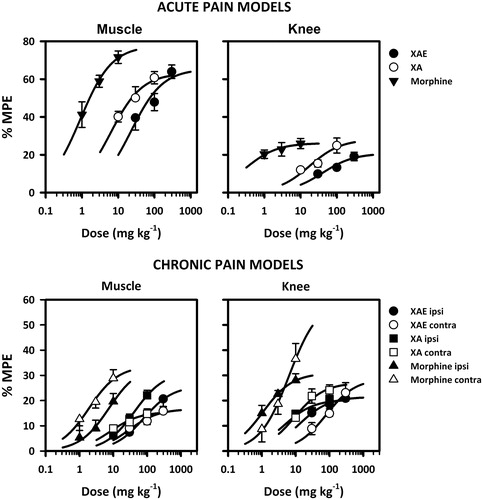
Figure 6. Dose-response curves of the effects of the extract, xylopic acid and morphine in the models used. Percentage MPEs were derived from the AUCs and the curves obtained by non-linear regression as described under Materials and methods.