Figures & data
Figure 1. Typical HPLC chromatographic profiles of six standards (A) and SFE (B). HPLC peaks: 1, schisandrol A; 2, schisandrol B; 3, schisantherin A; 4, schisandrin A; 5, schisandrin B; 6, schisandrin C.
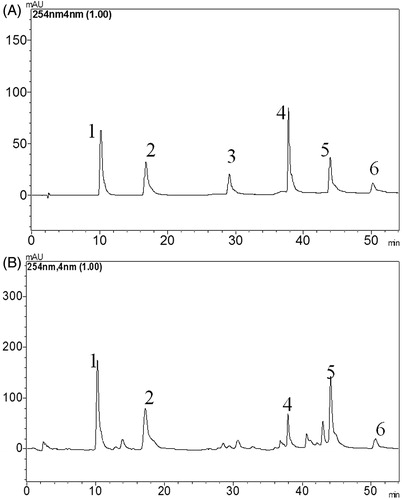
Table 1. Calibration curves of standard preparations (n = 5).
Figure 2. Effects of SFE on viabilities of THP-1 and HDF cells. Cells were exposed to SFE (at 6.25–100 μg/mL concentration) for 48 h. Data are expressed as the percentage of untreated cells, mean ± SD (n = 5).
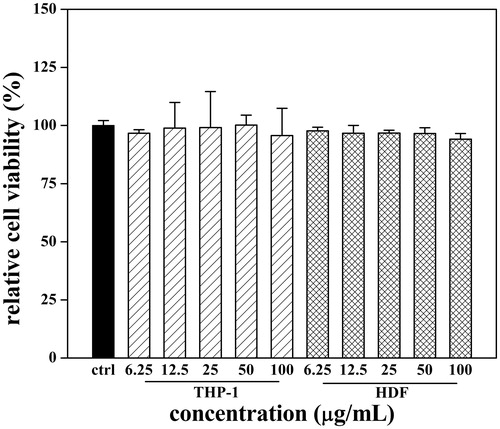
Figure 3. Establishment of P. acnes-induced inflammation model in vitro. THP-1 cells were incubated with different densities of live and heat-killed P. acnes (P. acnes: THP-1 = 1:1, 10:1 and 100:1) for 12 h or 24 h. Cell free supernatants were analysed for IL-1β. Data are the mean ± SD (n = 3).
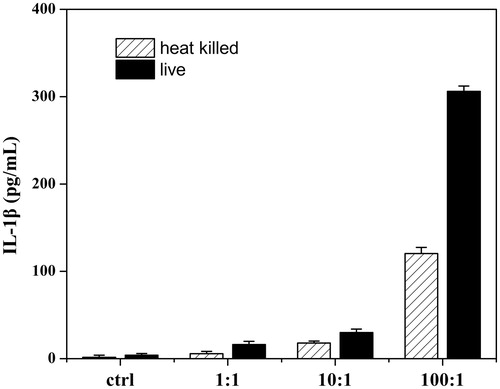
Figure 4. Effect of SFE on production of pro-inflammatory cytokines by P. acnes-stimulated monocytic THP-1 cells, including IL-1β (A), IL-8 (B) and TNF-α (C). THP-1 cells were pretreated with different concentrations (0, 6.25, 25 and 50 μg/mL) of SFE for 4 h, and then stimulated with live P. acnes (1 × 10⁷ CFU/mL) for 24 h. Cell free supernatants were analysed for IL-1β, IL-8 and TNF-α. A control group without P. acnes stimulation was conducted in parallel. Data are the mean ± SD. (n = 3). ###p < 0.001 compared with control cells, ***p < 0.001 compared with cells induced with P. acnes.
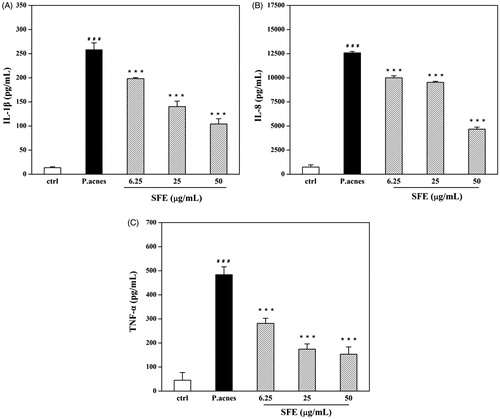
Figure 5. Establishment of UVB-irradiated photoageing model. HDF cells were exposed for different UVB radiation doses (50–3000 mJ/cm2) and exposure times (one or three times). After irradiation, cells were analysed viability (A) and supernatants were detected for production of Col-1 (B). A control group without UVB irradiation was conducted in parallel. Data are expressed as mean ± SD (n = 3). ***p < 0.001 compared with control cells.
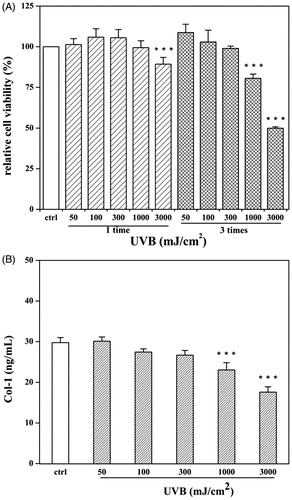
Figure 6. Effects of SFE on production of Col-1 (A) and secretion of MMP-1 (B) in UVB-irradiated fibroblasts HDF. HDF cells were pretreated with different concentrations (0, 2.5, 5 and 10 μg/mL) of SFE and irradiated with a UVB dose of 3000 mJ/cm2 every 12 h (three times in total). The control group without UVB irradiation was conducted in parallel. Cell free supernatants were analysed for Col-1 and MMP-1. Data are the mean ± SD (n = 3). ##p < 0.01 and ###p < 0.001 compared with control cells, *p < 0.05 and ***p < 0.001 compared with cells only irradiated by UVB.
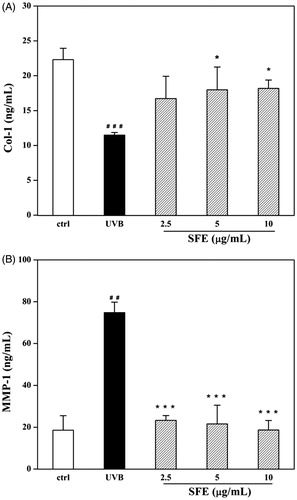
Figure 7. Effect of SFE on MDA level in UVB-irradiated HDF cells. HDF cells were pretreated with different concentrations (0, 2.5, 5 and 10 μg/mL) of SFE and irradiated with UVB (3000 mJ/cm2) every 12 h for three times. Control group without UVB irradiation was conducted in parallel. Cell homogenates were detected for MDA. Data are the mean ± SD (n = 3). ##p < 0.01 compared with control cells, *p < 0.05 compared with cells only treated by UVB.
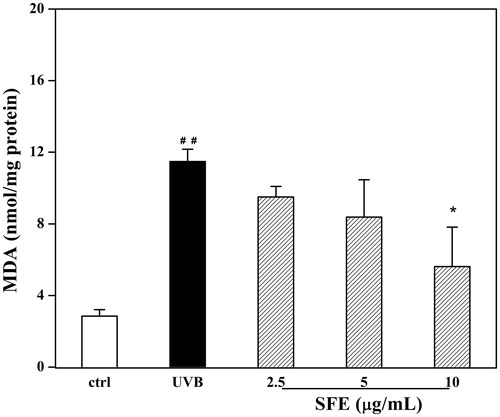
Figure 8. Effect of SFE on cellular GSH level in UVB-irradiated HDF cells. HDF cells were incubated with different concentrations (0, 2.5, 5 and 10 μg/mL) of SFE and irradiated by UVB (3000 mJ/cm2) every 12 h for three times. Control group without UVB irradiation was conducted in parallel. Cell homogenates were detected for GSH. Data are the mean ± SD (n = 3). ###p < 0.001 compared with control cells, ***p < 0.001 compared with cells only treated by UVB.
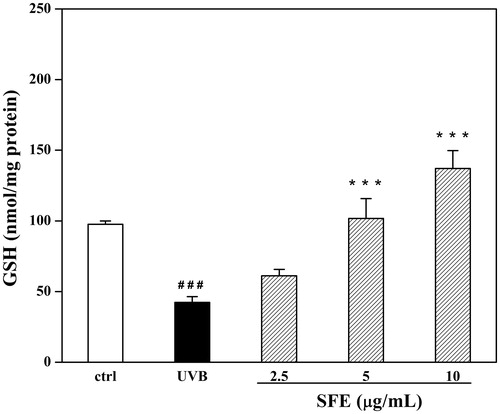
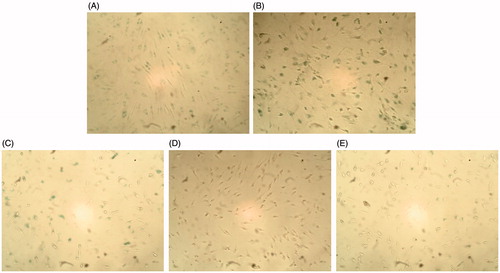
Figure 9. Effect of SFE on the positive expression of SA-β-gal in UVB-irradiated HDF cells. HDF cells were pretreated with different concentrations (0, 2.5, 5 and 10 μg/mL) of SFE and irradiated with UVB (3000 mJ/cm2) every 12 h for three times. SA-β-gal positive cells were photographed under ×100 magnifications. (A) Cells without UVB irradiation. (B) Only UVB irradiated. (C) UVB irradiation +2.5 μg/mL SFE. (D) UVB irradiation +5 μg/mL SFE. (E) UVB irradiation +10 μg/mL SFE.