Figures & data
Figure 1. Structure of d-borneol.
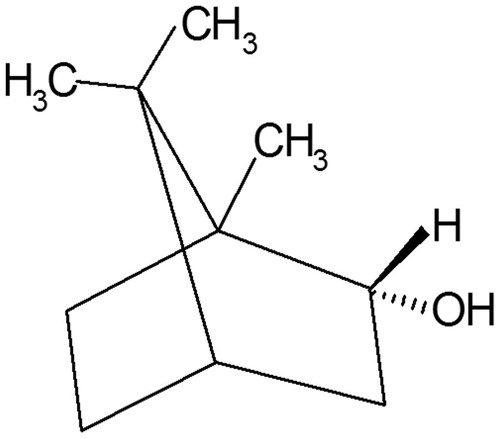
Table 1. Sequence primers of claudin-5, occludin, ZO-1 and F-actin.
Figure 2. Representative T1-weighted MR images in the same C6 glioma rat by (A) day 7 and (B) day 14 after implantation. The zone in circle indicates the tumour area.
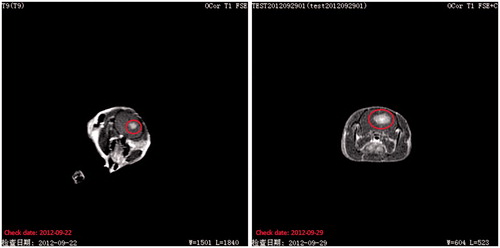
Figure 3. Concentration–time curves of cisplatin in the brain tissue of glioma tumour-bearing SD rats injected with 10 mg/kg of cisplatin 1 h after oral administration of borneol.
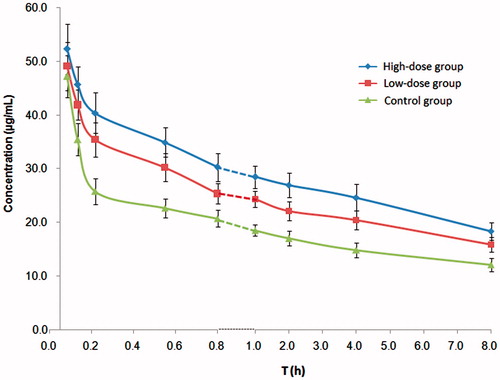
Table 2. Pharmacokinetic parameters of cisplatin in the brain tissue of glioma tumour-bearing SD rats injected with 10 mg/kg of cisplatin 1 h after oral administration of borneol. (x ± s, n = 6).
Figure 4. Quantitative real-time PCR RQ of (A) ZO-1, (B) F-actin, (C) occludin and (D) claudin-5. Values are presented as means ± SD (n = 6, each group). #p < 0.05 and ##p < 0.01 tumour-bearing brain of the 140 mg/kg borneol-treated group versus tumour-bearing brain of the control group; *p < 0.05 and **p < 0.01 tumour-bearing brain of the 140 mg/kg borneol-treated group versus tumour-bearing brain of the 35 mg/kg borneol-treated group; ▴p < 0.05 and ▴▴p < 0.01 tumour-bearing brain of the 35 mg/kg borneol-treated group versus tumour-bearing brain of the control group.
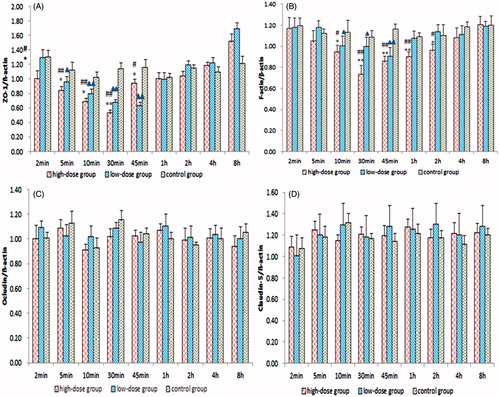
Figure 5. Concentrations of (A) ZO-1, (B) F-actin, (C) occludin and (D) claudin-5 by ELISA. Values are presented as means ± SD (n = 6, each group). #p < 0.05 and ##p < 0.01 tumour-bearing brain of the 140 mg/kg borneol-treated group versus tumour-bearing brain of the control group; *p < 0.05 and **p < 0.01 tumour-bearing brain of the 140 mg/kg borneol-treated group versus tumour-bearing brain of the 35 mg/kg borneol-treated group; ▴p < 0.05 and ▴▴p < 0.01 tumour-bearing brain of the 35 mg/kg borneol-treated group versus tumour-bearing brain of the control group.
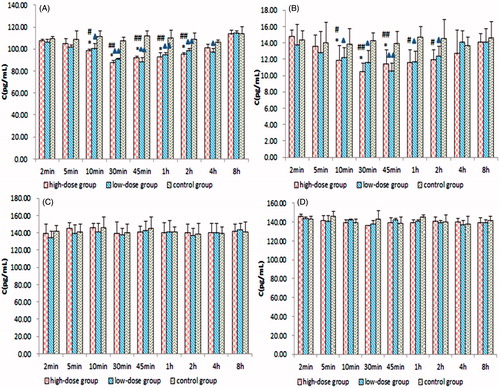
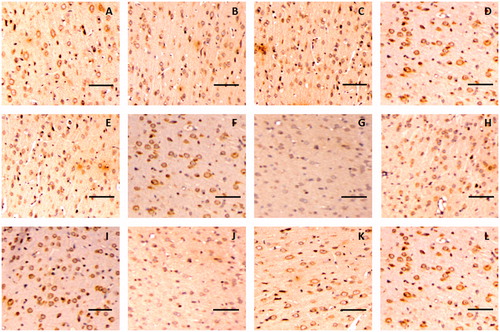
Figure 6. Representative immunohistochemical images of claudin-5 in brain tissue of glioma rat after borneol exposure at different time points: (A) 5 min in control group, (B) 30 min in control group, (C) 45 min in control group, (D) 2 h in control group, (E) 5 min in low-borneol group, (F) 30 min in low-borneol group, (G) 45 min in low-borneol group, (H) 2 h in low-borneol group, (I) 5 min in high-borneol group, (J) 30 min in high-borneol group, (K) 45 min in high-borneol group and (L) 2 h in high-borneol group. Scale bars, 100 μm.
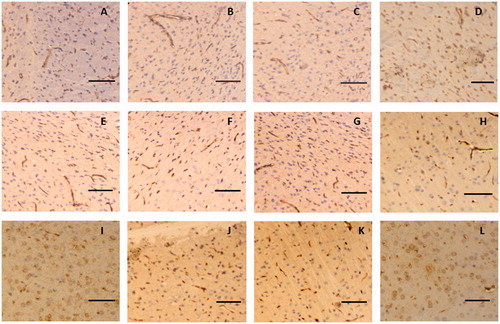
Figure 7. Representative immunohistochemical images of occludin in the brain tissue of glioma rat after borneol exposure at different time points: (A) 5 min in the control group, (B) 30 min in the control group, (C) 45 min in the control group, (D) 2 h in the control group, (E) 5 min in the low-borneol group, (F) 30 min in the low-borneol group, (G) 45 min in the low-borneol group, (H) 2 h in the low-borneol group, (I) 5 min in the high-borneol group, (J) 30 min in the high-borneol group, (K) 45 min in the high-borneol group and (L) 2 h in the high-borneol group. Scale bars, 100 μm.
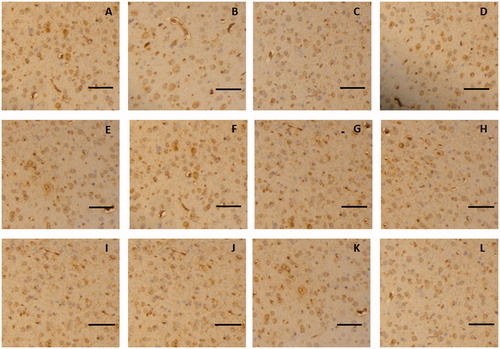
Figure 8. Representative immunohistochemical images of ZO-1 in the brain tissue of glioma rat after borneol exposure at different time points: (A) 5 min in the control group, (B) 30 min in the control group, (C) 45 min in the control group, (D) 2 h in the control group, (E) 5 min in the low-borneol group, (F) 30 min in the low-borneol group, (G) 45 min in the low-borneol group, (H) 2 h in the low-borneol group, (I) 5 min in the high-borneol group, (J) 30 min in the high-borneol group, (K) 45 min in the high-borneol group and (L) 2 h in the high-borneol group. Scale bars, 100 μm.
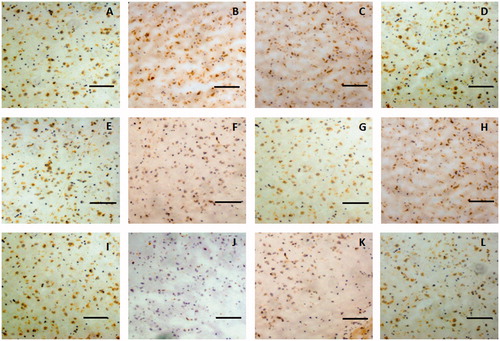
Figure 9. Representative immunohistochemical images of F-actin in the brain tissue of glioma rat after borneol exposure at different time points: (A) 5 min in the control group, (B) 30 min in the control group, (C) 45 min in the control group, (D) 2 h in the control group, (E) 5 min in the low-borneol group, (F) 30 min in the low-borneol group, (G) 45 min in the low-borneol group, (H) 2 h in the low-borneol group, (I) 5 min in the high-borneol group, (J) 30 min in the high-borneol group, (K) 45 min in the high-borneol group and (L) 2 h in the high-borneol group. Scale bars, 100 μm.