Figures & data
Table 1. Primer sequences used for RT-PCR analysis.
Table 2. Blood glucose and serum insulin.
Table 3. Glycated haemoglobin and serum fructosamine.
Figure 1. Equal concentrations of protein aliquots from heart cell lysates were separated using SDS–PAGE and blotted on to nitrocellulose membranes and later probed with anti-AGE antibody. (a) Location of bands ∼60 kDa in the heart extracts of experimental groups. (b) Intensity of bands ∼60 kDa was quantified using Biorad gel doc and plotted. The results presented are average of quadruplicate experiments ± SD statistically significant p ≤ 0.05.
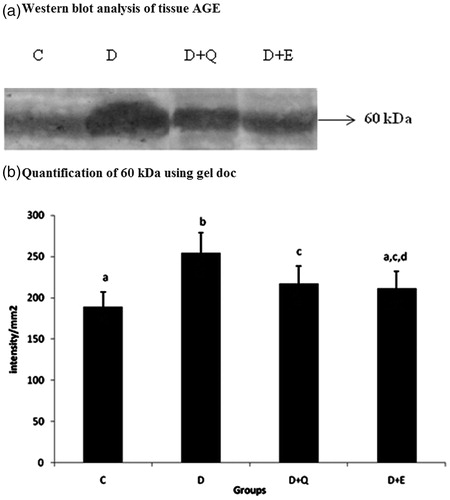
Figure 2. The relative amount of RAGE mRNA was estimated by semi-quantitative RT-PCR. The PCR products were quantified by densitometry and standardized to their respective GAPDH controls. The mean intensity was measured and expressed as INT/mm2. Results are expressed as average of quadruplicate experiments ± SD statistically significant p ≤ 0.05.
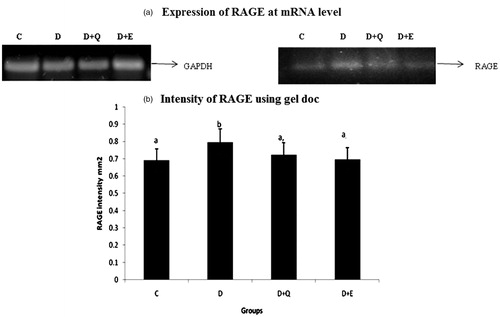
Figure 3. Equal concentrations of protein aliquots from heart cell lysates were separated using SDS–PAGE and blotted on to nitrocellulose membranes and later probed with anti RAGE antibody. (a) Location of bands ∼45 kDa in the heart extracts of experimental groups. (b) Intensity of bands ∼45 kDa was quantified using Biorad gel doc and plotted. The results presented are average of quadruplicate experiments ± SD statistically significant p ≤ 0.05.
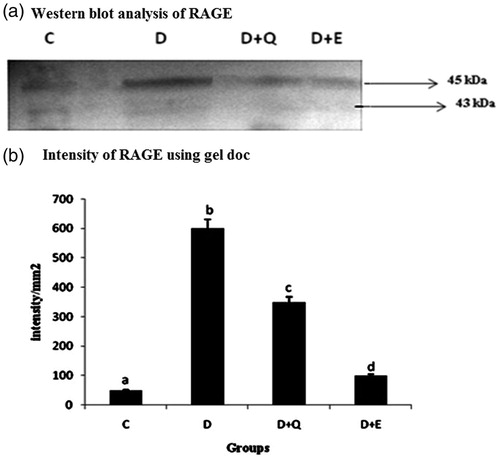
Figure 4. Equal concentrations of protein aliquots (Lowry’s method) from heart cell lysates were separated using SDS–PAGE and blotted on to nitrocellulose membranes and later probed with anti-NFκB p65 antibody. Location of bands ∼65 kDa in the nuclear and cytoplasmic fraction of heart extracts of experimental groups. (b) Intensity of bands ∼65 kDa was quantified using Biorad gel doc and plotted. The results presented are average of quadruplicate experiments ± SD statistically significant p ≤ 0.05.
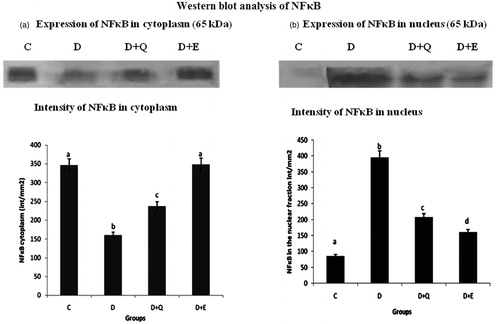
Figure 5. The relative amount of TGF-β1 mRNA was estimated by semi-quantitative RT-PCR. The PCR products were quantified by densitometry and standardized to their respective GAPDH controls. The mean intensity was measured and expressed as INT/mm2. Results are expressed as average of quadruplicate experiments ± SD statistically significant p ≤ 0.05.
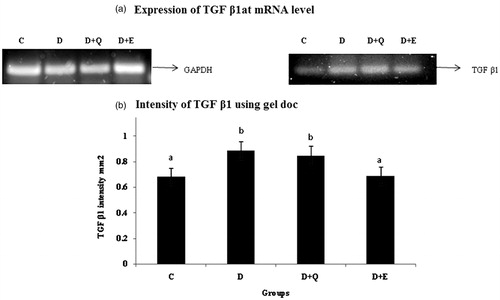
Figure 6. The relative amount of CTGF mRNA was estimated by semi-quantitative RT-PCR. The PCR products were quantified by densitometry and standardized to their respective GAPDH controls. The mean intensity was measured and expressed as INT/mm2. Results are expressed as average of quadruplicate experiments ± SD statistically significant p ≤ 0.05.
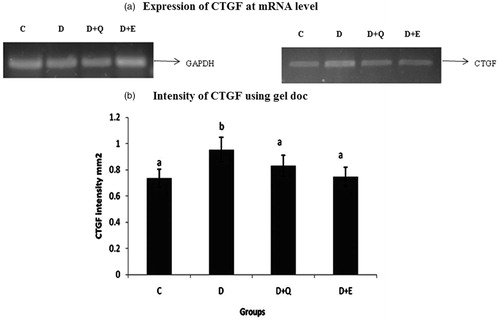
Figure 7. The relative amount of BNP mRNA was estimated by semi-quantitative RT-PCR. The PCR products were quantified by densitometry and standardized to their respective GAPDH controls. The mean intensity was measured and expressed as INT/mm2. Results are expressed as average of quadruplicate experiments ± SD statistically significant p ≤ 0.05.
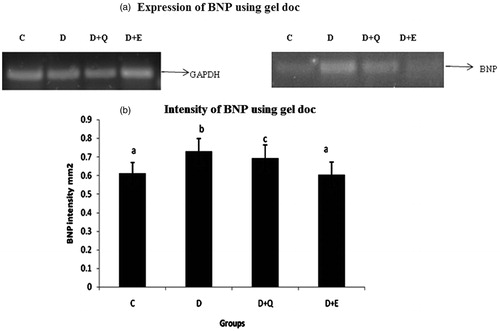
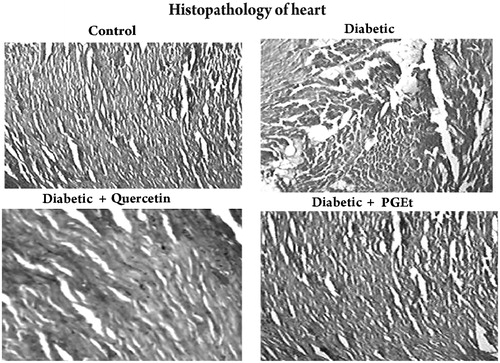
Figure 8. Light microscopic appearance of the heart sections stained with haematoxylin and eosin (magnification 40×). Group – Control: Heart of control rat showing normal myocardial fibres with normal cell structure. Group – Diabetic: Heart of diabetic rats showing severe necrosis, inflammatory infiltration, oedema with degeneration. Group – Diabetic + Quercetin: Quercetin treatment improved the myocardial degeneration with mild inflammatory infiltration when compared to the heart of diabetic rats. Group – Diabetic + Extract: Administration of PGEt also improved the myocardial degeneration when compared to diabetic control.