Figures & data
Figure 1. A representative UPLC-negative ionization MS trace of methanol extract of H. subdariffa flowers, peak numbers follow those listed in for metabolite identification using UPLC-PDA-MS. IS, internal standard (umbelliferone); Rt, retention time.
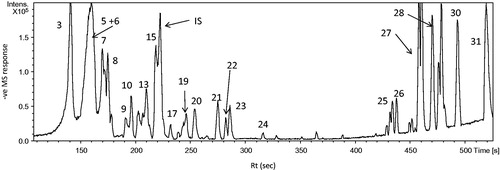
Figure 2. Structures of some identified compounds detected via UPLC-qTOF-PDA-MS analysis of H. subdarifa anthocyanin-rich extract (HSARE).
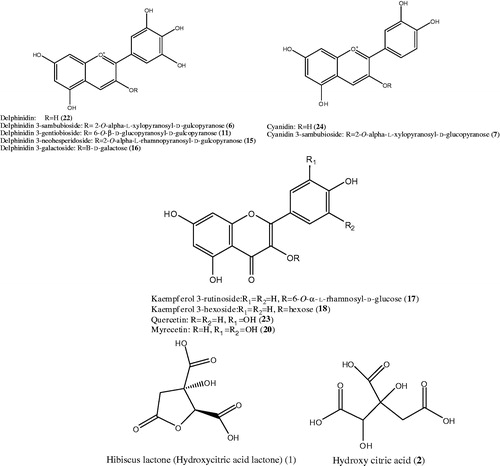
Table 1. Peak assignments of metabolites in HSARE using UPLC-PDA-MS in negative ionization mode.
Figure 3. (a) Rats liver section injected with a single intraperitoneal dose (100 mg/kg) of TAA once per week for 1 month showing portal tract infiltration with chronic inflammatory cells (thin arrow), focal spotty necrosis (inflammatory cells in between hepatocytes, thick arrow, (b and c) rats injected with a single intraperitoneal dose (200 mg/kg or 300 mg/kg, respectively) of TAA once per week for 1 month showed portal tracts area infiltrated by moderate number of chronic inflammatory cells (thin arrow), focal spotty necrosis (thick arrow), inflammatory cells in between hepatocytes (H&E × 200).
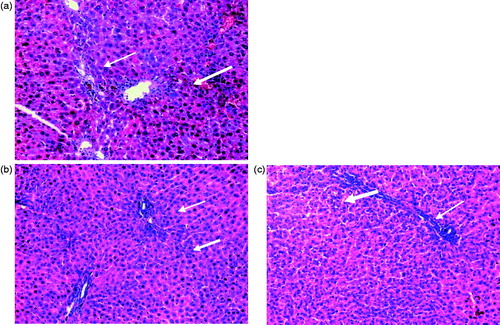
Table 2. Effect of HSARE on hepatic marker enzymes, anti-inflammatory markers, oxidative stress and lipid peroxidation after 4 weeks of thioacetamide (TAA) intoxication in rats.
Figure 4. Histopathological examination of liver sections from normal untreated rats (a) showing normal hepatic architectecture, TAA-intoxicated (100 mg/kg) rats (b) showing severely disturbed hepatic architecture and portal tract inflammation with severe lymphocyte infiltration (thick arrow) and focal spotty necrosis (thin arrow), silymarin-treated (50 mg/kg) rats (c) showing almost normal hepatic architectural pattern with mild ballooning of hepatocytes, mild dilation of sinusoids and lymphocyte infiltration and HSARE-treated (100 mg/kg) rats (d) showing normal hepatic architecture with mild ballooning of hepatocytes and mild number of chronic inflammatory cells infiltration (H&E × 200).
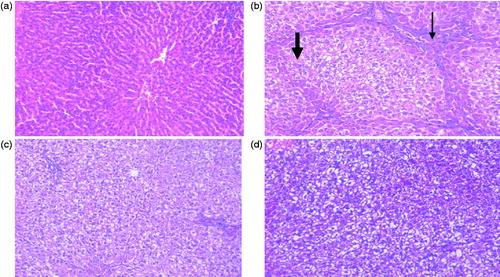
Figure 5. Bar graphs represent liver (n = 6) per cent of hepatocytes with positively stained brown cytoplasm (caspase-3 and CYP2E1) or brown nuclei (NF-κB), in 10 successive fields. aSignificantly different from normal control at p < 0.05. bSignificantly different from TAA at p < 0.05.
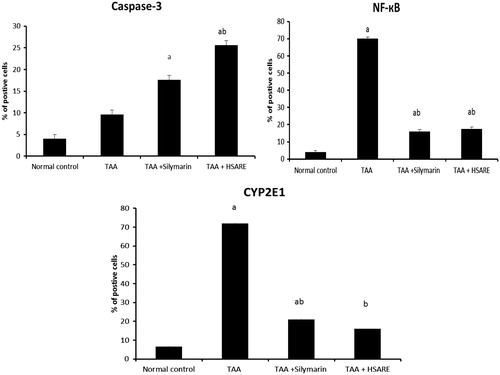
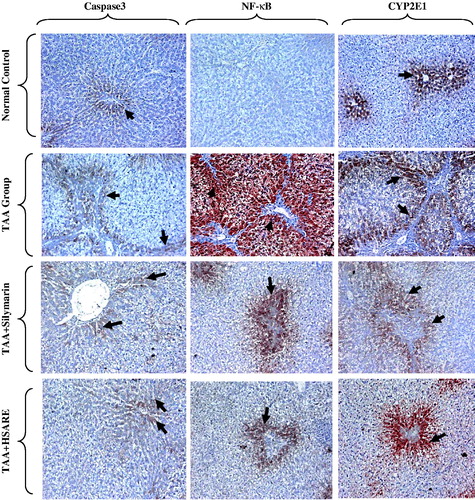
Figure 6. Immunohistochemical staining of rat liver sections for caspase-3, NF-κB and CYP2E1, showing normal control rats with few number of positive hepatocytes for caspase-3, NF-КB and CYP2E1 appearing as brownish stain (black arrows), TAA-intoxicated (100 mg/kg) rats showing few positive hepatocytes (centrilobular and periportal areas) with mild density for caspase-3, and many positive hepatocytes (centrilobular and periportal areas) with severe density for NF-κB and CYP2E1 (black arrows), and silymarin and HSARE-treated rats (50 and 100 mg/kg, respectively) showing moderate number of positive hepatocytes (periportal areas) with moderate density (periportal areas) for caspase-3 NF-κB and CYP2E1 (black arrows), (IHC, DAB, × 200).