Figures & data
Figure 1. Quercetin selectively inhibits the proliferation and induces apoptosis in HSCs. (A) MTS assay for evaluating HSC proliferation. Significance *p < .05 versus control, **p < .01 versus control. (B) MTS assay for evaluating human LO2 hepatocyte proliferation. Significance *p < .05 versus control. (C) Flow cytometry analyses of HSC apoptosis using FITC-labelled Annexin-V/PI staining. Cells situated in the right two quadrants of each plot were regarded as apoptotic cells. (D) TUNEL staining for evaluating HSC apoptosis.
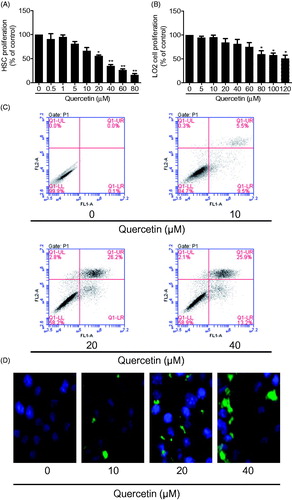
Figure 2. Quercetin stimulates mitochondrial apoptosis associated with caspase activation in HSCs. (A) Western blotting analyses of Bcl-2 family proteins, (B) cytochrome c abundance in mitochondria and cytoplasm, respectively, and (C) caspase cascades and PARP-1 in HSCs.
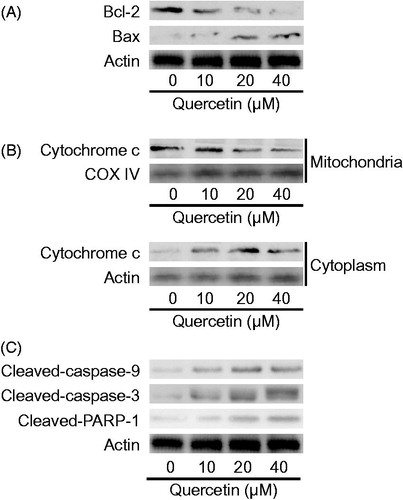
Figure 3. Quercetin activates ERS pathway in HSCs. (A) Real-time PCR analyses of calnexin and CHOP in HSCs and human LO2 hepatocytes. Significance **p < .01 versus control. (B) Western blotting analyses of calnexin and CHOP in HSCs and human LO2 hepatocytes. (C) Western blotting analyses of PERK, IRE1and ATF6 in HSCs.
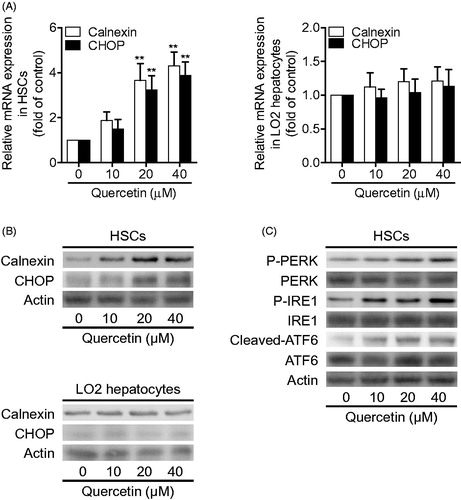
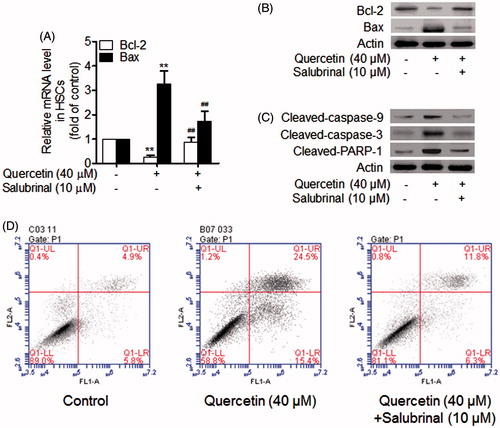
Figure 4. Activation of ERS is required for quercetin induction of apoptosis in HSCs. (A) Real-time PCR analyses of Bcl-2 family genes in HSCs. Significance **p < .01 versus control, ##p < .01 versus quercetin. (B) Western blotting analyses of Bcl-2 family proteins in HSCs. (C) Western blotting analyses of caspase cascades and PARP-1 in HSCs. (D) Flow cytometry analyses of HSC apoptosis using FITC-labelled Annexin-V/PI staining. Cells situated in the right two quadrants of each plot were regarded as apoptotic cells.