Figures & data
Figure 1. Effect of OXL (50, 100 and 150 mg/kg, i.p.) on mice for permanence time on the swivel bar in seconds. Values are expressed as mean ± S.E.M. ANOVA ‘one way’ followed by Dunnet's test. ***p < .001 versus control group (vehicle).
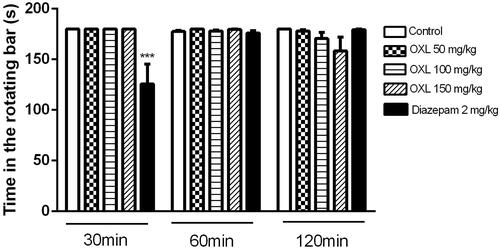
Figure 2. Effect of OXL (50, 100 and 150 mg/kg; i.pon the number of writhes induced by acetic acid in mice. Values are expressed as mean ± S.E.M. ANOVA ‘one way’ followed by Dunnet's test. ***p < .001 versus control group (vehicle).
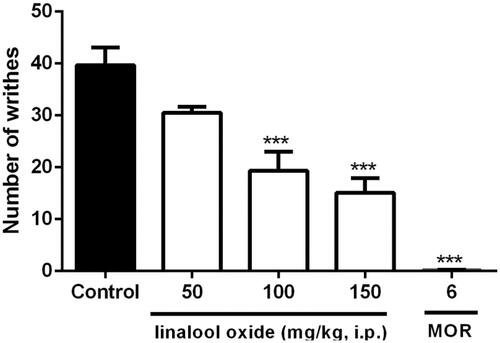
Figure 3. Effect of OXL (50, 100 and 150 mg/kg, i.p.) on paw-licking time in the first (A), and second (B) phases of the formalin test in mice. Values are expressed as mean ± S.E.M. ANOVA ‘one way’ followed by Dunnet’s test. *p < .05; **p < .01; ***p <.001 versus the control group (vehicle).
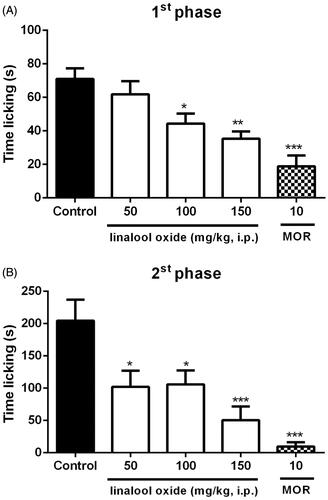
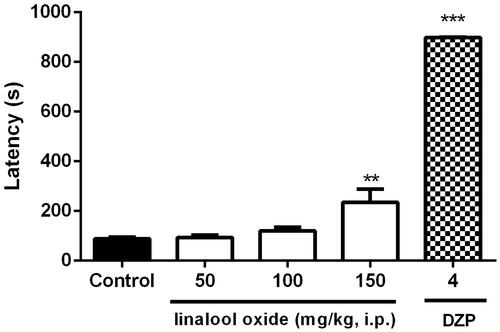
Figure 4. Effect of OXL (50, 100 and 150 mg/kg; i.p.) on the duration of tonic convulsions in the Maximum Electroshock test in mice. Values are expressed as mean ± S.E.M. ANOVA ‘one way’ followed by Dunnet's test. **p < .01; ***p < .001 versus the control group (vehicle).
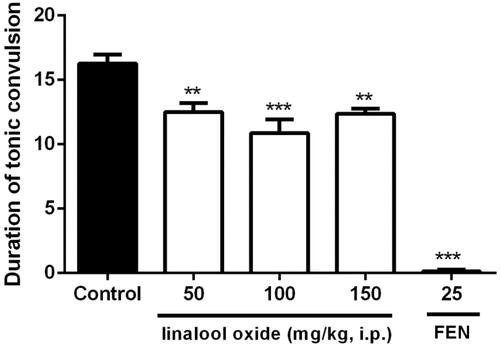
Figure 5. Effect of OXL (50, 100 and 150 mg/kg, i.p.) on the onset latency to the first seizure in the pentylenetetrazol induced seizures test in mice. Values are expressed as mean ± S.E.M. ANOVA ‘one way’ followed by Dunnet's test. **p < .01; ***p < .001 versus control group (vehicle).