Figures & data
Figure 1. The 2-DE proteome images of control (A) and RC-treated (B) platelets. The differentially expressed protein spots were shown by the arrows.
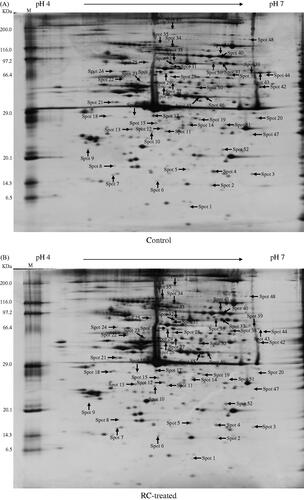
Figure 2. The differentially expressed protein spots in .
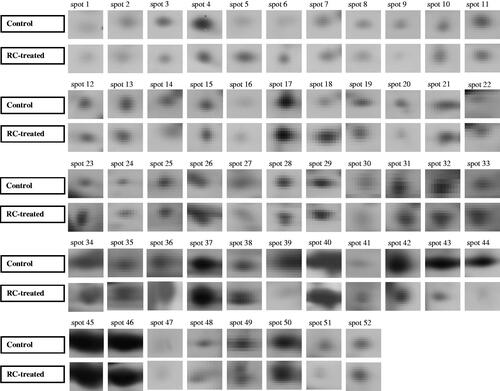
Table 1. The results of proteins identification of differentially expressed proteins using MALDI-TOF-MS/MS.
Figure 3. Effect of RC on the platelet intracellular calcium [Ca2+]i concentration [A, mean ± SD (n = 3), ###p < .001, vs. resting platelet group, **p < .01, ***p < .001, ##p < .01, vs. THR activated group], P-selectin [B, mean ± SD (n = 3), #p < .05, vs. resting platelet group, *p < .05, vs. THR-activated group], cGMP [C, mean ± SD (n = 3), ##p < .01, vs. resting platelet group, *p < .05, vs. THR-activated group] and 5-HT [D, mean ± SD (n = 3)].
![Figure 3. Effect of RC on the platelet intracellular calcium [Ca2+]i concentration [A, mean ± SD (n = 3), ###p < .001, vs. resting platelet group, **p < .01, ***p < .001, ##p < .01, vs. THR activated group], P-selectin [B, mean ± SD (n = 3), #p < .05, vs. resting platelet group, *p < .05, vs. THR-activated group], cGMP [C, mean ± SD (n = 3), ##p < .01, vs. resting platelet group, *p < .05, vs. THR-activated group] and 5-HT [D, mean ± SD (n = 3)].](/cms/asset/60200834-8c26-40d6-a3c9-b4d9deaade96/iphb_a_1229340_f0003_b.jpg)
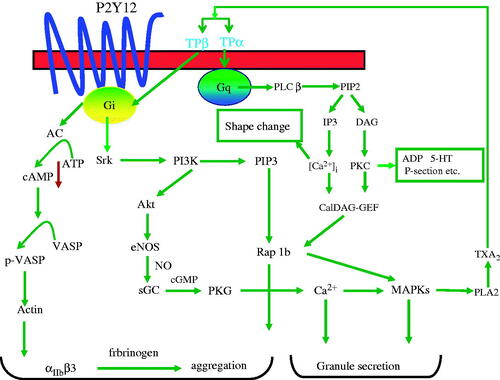
Figure 4. The possible signal pathways for RC antiplatelet function.