
Figures & data
Figure 1. Concentration-relaxant response curve of AMEO in guinea-pig tracheal tissue after (A) carbachol (3 × 10 − 6 M) or (B) histamine (3 × 10 − 5 M)-induced contractions. Each point represents mean ± S.E.M. of at least six experiments.
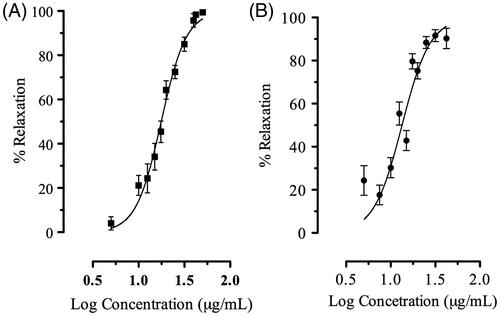
Figure 2. Modified Schild plot for noncompetitive antagonism effect, according to the equation pA2′ = pBx′ + Log (X-1), where pBx′ is the negative logarithm of the concentration (-Log B′) of antagonist (AMEO) and X is the ratio between maximal effect (Emax) of (A) carbachol or (B) histamine in the absence of antagonist (AMEO) and that in the presence of antagonist (AMEO on guinea-pig tracheal tissue. The pA2′ value is the abscissa to the origin of the graph Log (X-1) vs pBx′, when X = 2. Each point represents mean ± S.E.M. of at least six experiments.
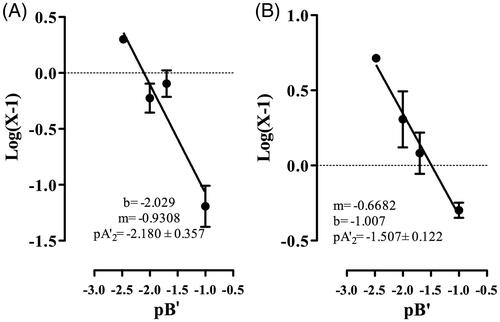
Figure 3. Calcium chloride-induced contractions on guinea-pig tracheal tissue in absence (•) or in presence of AMEO (▪ 25 μg/mL; ^ 50 μg/mL; ♦ 100 μg/mL). Each point represents mean ± S.E.M. of at least six experiments.
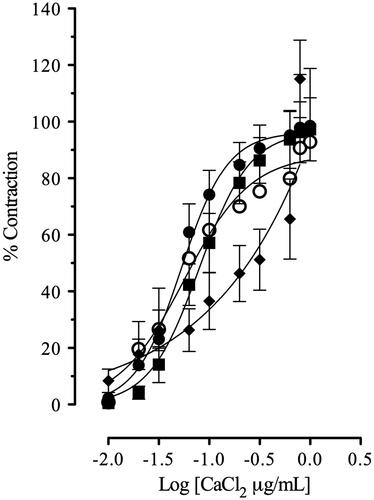
Figure 4. Concentration-response curve of AMEO alone (^) and in the presence of (A) propranolol 3 × 10 − 6 M (▴), (B) 2′,5′-dideoxyadenosine 3 × 10 − 6 M (▪) or (C) glibenclamide 10 − 7 M (•). The graphs depict the logarithm of the concentration of AMEO (5–50 μg/mL) plotted against tension expressed as % of contraction elicited by carbachol 3 × 10 − 6 M in guinea pig-tracheal tissue. Each point represents the mean ± S.E.M of at least six experiments.
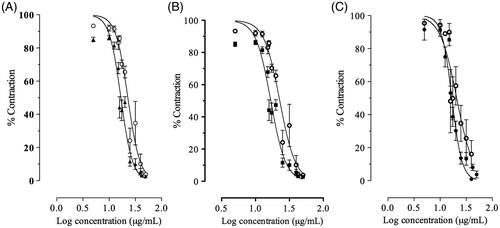
Table 1. Terpenoids identified in Agastache mexicana ssp. mexicana essential oil by GC/MS.