Figures & data
Table 1. Blood parameters of mice tested for Pleurotus sajor-caju toxicity.
Figure 1. In vivo concentration-response curve of aqueous extract of Pleurotus sajor-caju against blood stream Trypanosoma congolense using global sigmoidal model of curve fitting.
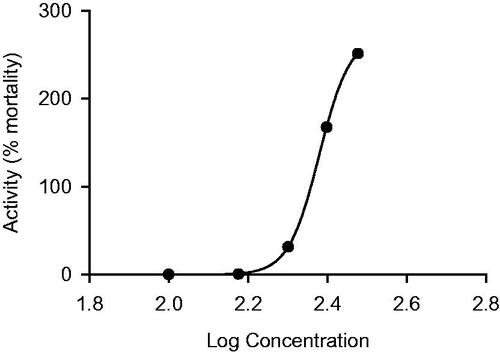
Figure 2. Parasitaemia in mice infected with Trypanosoma congolense post-treatment with Pleurotus sajor-caju bark extract and diminazine aceturate with time (days after the first day of treatment).
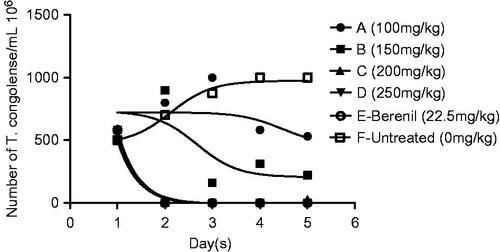
Table 2. Treatment of Trypanosoma congolense with Pleurotus sajor-caju and diminazine aceturate.
Figure 3. PCV and weight of mice pretreatment (day 9 post infection) and day 60 post treatments with Pleurotus sajor-caju extract and diminazine aceturate.
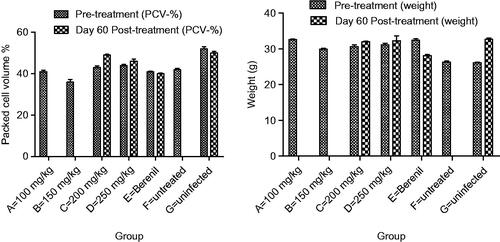
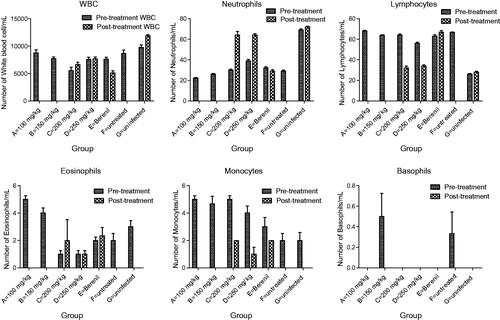
Figure 4. Blood differentials and white blood cell counts of experimental mice pretreatment (day 9 post-infection) and day 60 post-treatment with Pleurotus sajor-caju and diminazine aceturate.