
Figures & data
Table 1. Primer sequences used for qPCR.
Figure 1. Chemical structures of the isolated flavonoid compounds from D. glabra.
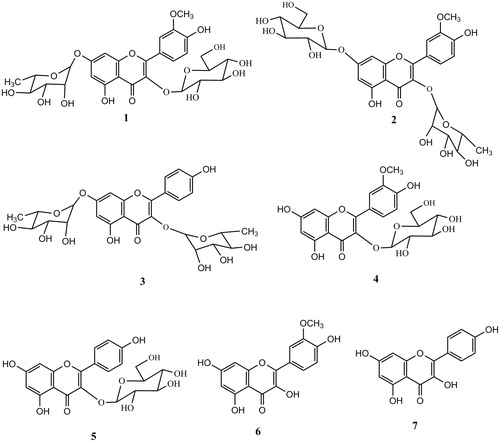
Figure 2. The changes of intracellular ROS levels in liver tissues of male rats exposed to CCl4 and/or D. glabra extract. DGE: D. glabra extract, DGE L: 50 mg/kg bw, DGE M: 100 mg/kg bw and DGE H: 200 mg/kg bw of D. glabra extract. Data are presented as mean ± SEM. a,b,c,d, are significantly different (p ≤ 0.05).
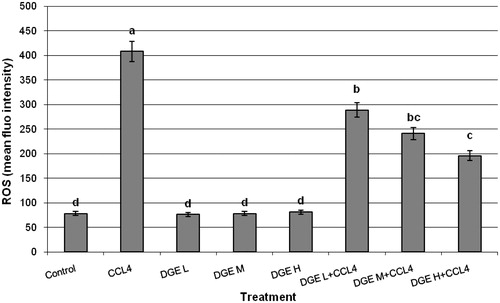
Figure 3. The alteration of GLAST, GLT-1 and SNAT3-mRNA in liver tissues of male rats exposed to CCl4 and/or D. glabra leaves extract. DGE: D. glabra extract, DGE L: 50 mg/kg bw, DGE M: 100 mg/kg bw and DGE H: 200 mg/kg bw of D. glabra extract. Data are presented as mean ± SEM. a,b,c,d, are significantly different (p ≤ 0.05).
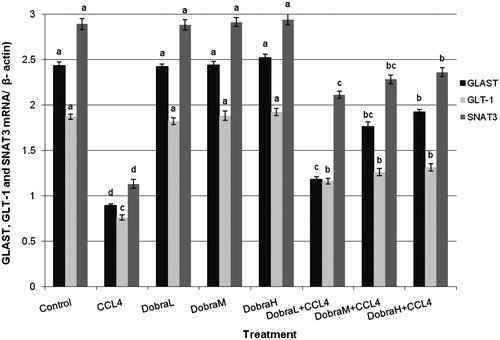
Figure 4. Rate of DNA fragmentation in liver tissues of male rats exposed to CCl4 and/or D. glabra leaves extract. DGE: D. glabra extract, DGE L: 50 mg/kg bw, DGE M: 100 mg/kg bw and DGE H: 200 mg/kg bw of D. glabra extract. Data are presented as mean ± SEM. a,b,c are significantly different (p ≤ 0.05).
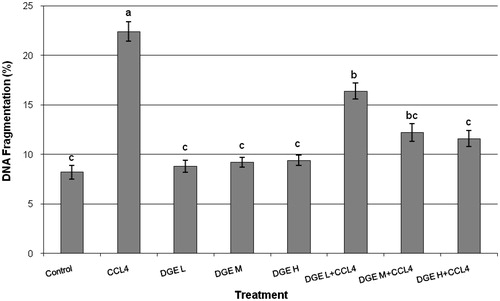
Table 2. The amount of glutathione peroxidase activity in male rats exposed to CCl4 and/or D. glabra leaves extract.