Figures & data
Table 1. Chemical analysis of native and degraded hyaluronic acid.
Figure 1. Elution profiles obtained by SEC with refractive index (dotted line), viscosity (long dash line) and LS at 90° (full line) of native (black) and degraded (grey) hyaluronic acid together with molecular weights (circle) and intrinsic viscosities (triangle) in LiNO3 0.1 mol/L.
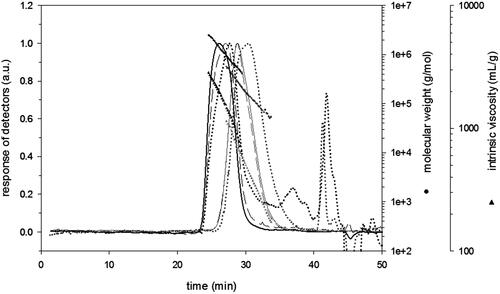
Table 2. Molecular changes of ultrasonic irradiated hyaluronic acid extracted from rooster comb.
Figure 2. ATR-FTIR spectra of native HA (a) and LMWHA (b) extracted from rooster comb.
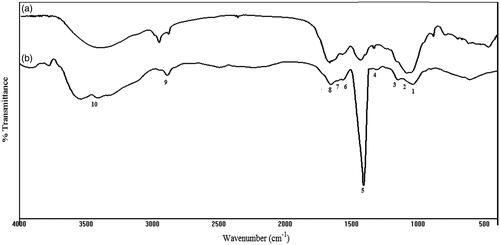
Table 3. Assignment of IR bands for HA and LMWHA.
Figure 3. UV–vis spectra of native HA of 1090 kDa; and LMWHA of 181 kDa extracted from rooster comb.
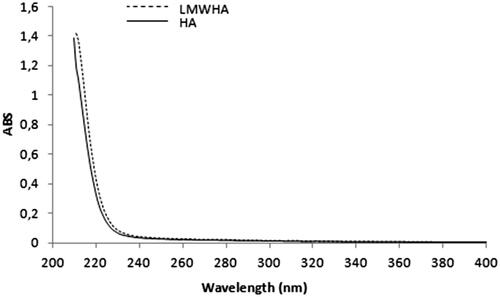
Figure 4. DPPH (A), NO (B), radical-scavenging capacity and inhibition of lipid peroxidation (C) of HA and LMWHA extracted from rooster comb. Ascorbic acid (AA) was used as standard. Each value is presented as mean ± SD (n = 3).
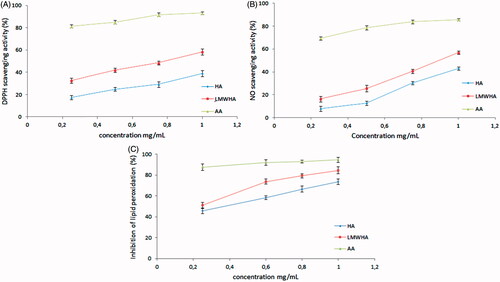
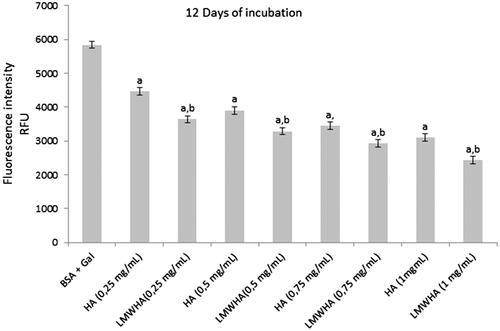
Figure 5. The effects of HA and LMWHA extracted from rooster comb on fluorescence formation in Gal-glycated BSA. Each value is presented as mean ± SD (n = 3). ap < .05 compared to BSA + Gal (galactose), bp < .05 LMWHA compared to HA.