Figures & data
Figure 1. In vitro inhibitory effects of Adiantum capillus-veneris AE, its bioactive phytoconstituents; chlorogenic acid, ellagic acid and ferulic acid, and orlistat concentrations on pancreatic triacylglycerol lipase activity. Results are mean ± SEM (n = 3 independent replicates).
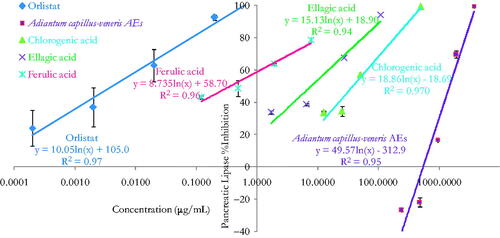
Table 1. In vitro pancreatic triacylglycerol lipase IC50 values for increasing concentrations of different parts of Adiantum capillus-veneris AEs, its bioactive phytoconstituent; chlorogenic acid, ellagic acid and ferulic acid, and orlistat. Results are mean ± SEM (n = 3 independent replicates).
Figure 2. In vitro inhibitory effects of Adiantum capillus-veneris AE (mg/mL) on enzymatic starch digestion. Results are mean ± SEM (n = 3 independent replicates). *p < 0.05 and ***p < 0.001 compared to control (drug-free or plant-free) incubations, as determined by ANOVA followed by Dunnett’s post-test.
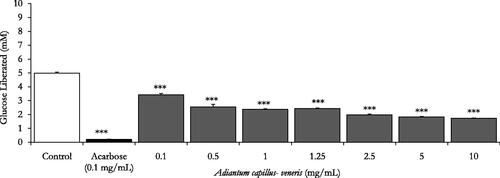
Figure 3. In vitro inhibitory effects of chlorogenic acid, A. capillus-veneris phytoconstituent (μg/mL) on enzymatic starch digestion. Results are mean ± SEM (n = 3 independent replicates). ***p < 0.001 compared to control (drug-free or plant-free) incubations, as determined by ANOVA followed by Dunnett’s post-test.
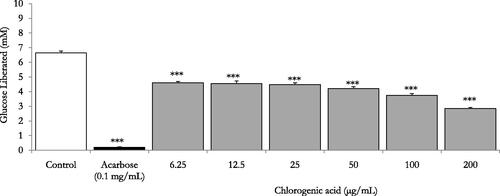
Table 2. Effects of ascending concentrations of different parts of A. capillus-veneris AE (mg/mL) and its bioactive phytoconstituent chlorogenic acid (μg/mL) on % reduction of enzymatic starch digestion in vitro. Results expressed as % decrease in control values are mean ± SEM (n = 3 independent determinations).
Figure 4. In vivo modulatory postprandial antihyperglycaemic effects of A. capillus-veneris AE (mg/kg b.wt) on oral starch tolerance over 165 min and AUC in normoglycaemic overnight fasting rats. *p < 0.05 and ***p < 0.001 compared to control untreated animals, as determined by ANOVA followed by Dunnett’s post-test.
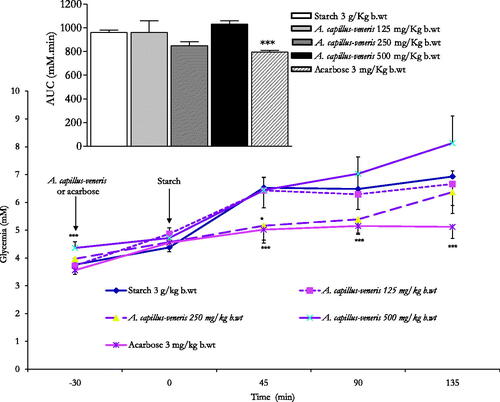
Figure 5. (A). Lack of in vivo modulatory postprandial antihyperglycaemic effects of A. capillus-veneris AE (mg/kg b.wt) on oral glucose tolerance over 165 min and AUC in normoglycaemic overnight fasting rats. **p < 0.01 and ***p < 0.001 compared to control untreated animals, as determined by ANOVA followed by Dunnett’s post-test. (B). Lack of modulatory in vitro effects of A. capillus-veneris AE (mg/mL) on the incremental AUC of 24-h glucose movement. ***p < 0.001 compared to control (drug-free or plant-free) incubations, as determined by ANOVA followed by Dunnett’s post-test.
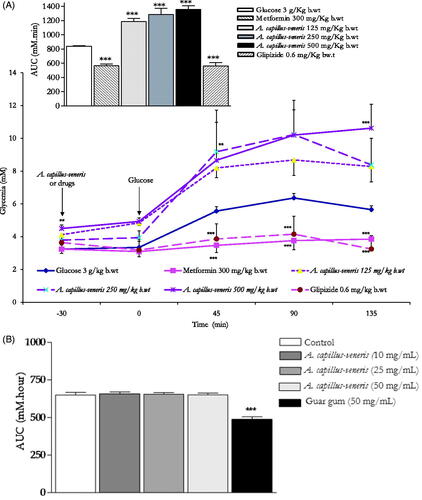
Figure 6. In vivo chronic effects of A. capillus-veneris AE (500 mg/kg b.wt) on the incremental AUC of 10-week treatment on the body weight. Results are expressed as mean ± SEM of area under curve (AUC) of body weight for 10-week intervention using ANOVA followed by Dunnett’s post-test, where *p < 0.05 and **p < 0.01 compared to control group, ΔΔΔp < 0.001 compared to HCD group, and ∇∇p < 0.01 compared to atorvastatin group.
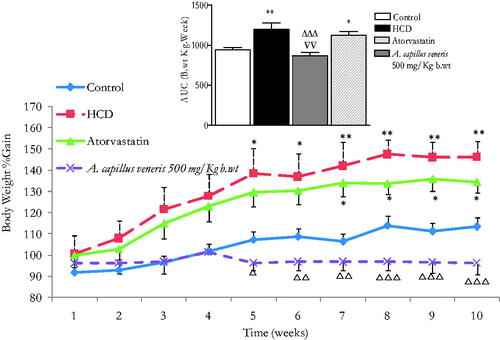
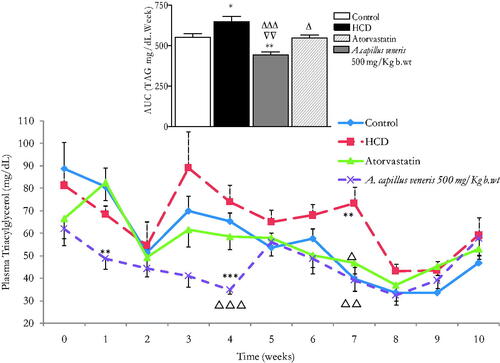
Figure 7. In vivo chronic effects of A. capillus-veneris AE (500 mg/kg b.wt) on the incremental AUC of 10 weeks treatment on triglycerides (TAG) concentrations. Results are expressed as mean ± SEM of AUC (area under curve) of TAG for 10-week intervention using ANOVA followed by Dunnett’s post-test where *p < 0.05 and **p < 0.01 compared to control group, Δp < 0.05 and ΔΔΔp < 0.001 compared to HCD group and ∇∇p < 0.01 compared to atorvastatin group.