
Figures & data
Table 1. Grading score.
Table 2. Variation of the body weights of rats among theexperimental period.
Figure 1. Digital photographs of the wound surfaces in each group on 1st, 3rd, 5th and 8th days. A, B and C laser wounds treated with saline solution with 6.81%, 15.45% and 32.27% wound closure on 3rd, 5th and 8th days, respectively. D, E and F laser wound treated with ‘CYTOL BASIC®’ with 9.11%, 20% and 61.36% wound closure on 3rd, 5th and 8th days, respectively. G, H and I laser wound treated with PLFO with 41.81%, 60% and 100% wound closure on 3rd, 5th and 8th days, respectively.
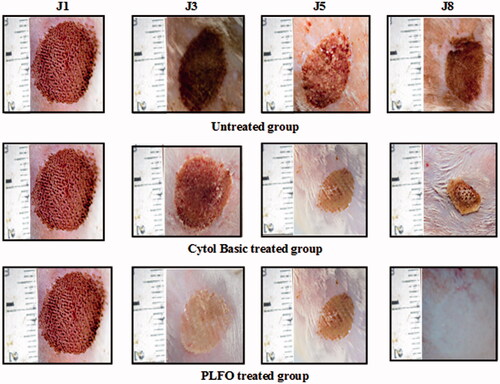
Figure 2. Mean scores for the comparison of the three groups after 1, 3, 5 and 8 days using Duncan multiple range test. (A) Erythema mean score; with marked, moderate and absence of erythema on 8th day for untreated, reference and tested group, respectively. (B) Crusting/scabbing mean score; extensive, moderate and absence of Crusting/scabbing on 8th day for untreated, reference and tested group, respectively. (C) General wound appearance mean score; fair, good and excellent general wound appearance on 8th day for untreated, reference and tested group, respectively. Group 1: untreated (Saline solution), Group 2: ‘CYTOL BASIC®’ cream (Reference) Group 3: Pistacia lentiscus fruit oil (Tested oil) Values represent means ± S.D (n = 6) in each group. *p < 0.05, **p < 0.01 and ***p < 0.001. (a): compared to untreated group; (b): compared to reference group.
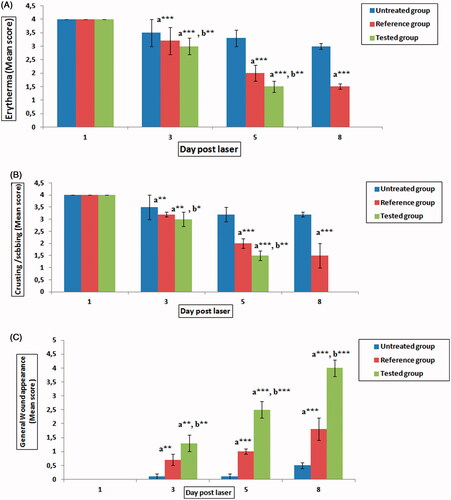
Figure 3. Percentage of burn wound contraction for the three studied groups. Untreated group: rats were treated with saline solution with 32.27% wound contraction on 8th day; reference group: rats were treated with reference drug ‘CYTOL BASIC’ with 61.36% wound contraction on 8th day; Tested group: rats were treated with PLFO with 100% wound contraction on 8th day, respectively. Values represent means ± S.D (n = 6) in each group. *p < 0.05, **p < 0.01 and ***p < 0.001. (a): compared to untreated group; (b): compared to reference group.
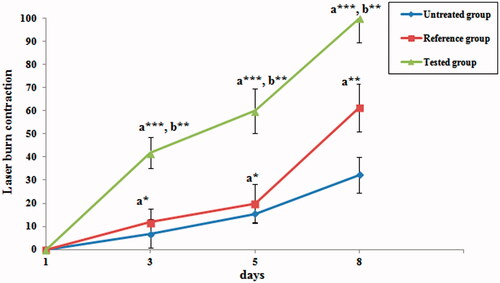
Figure 4. Histologic features of skin sections from burned area stained with hematoxyline–eosin after 8 d of burn induction; (A) untreated wound Gr 100; (B) Untreated wound Gr 200 with thickened and immature epidermis with debridement crust overlying the area of the wound; (C) reference drug ‘CYTOL BASIC’ treated wound Gr 100; (D) reference drug ‘CYTOL BASIC’ treated wound Gr 200 with reduced inflammation and enhanced wound contraction; (E) PLFO-treated wound Gr 100; (F) PLFO-treated wound Gr 200 with intact epidermis, re-epithelialization, regeneration of granulation tissue, angiogenesis and collagen deposition were detected in the treated wounds. Ep: epidermis; N: inflammatory nucleus.
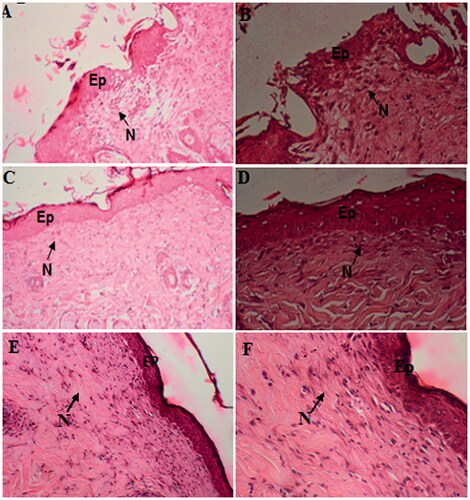
Table 3. Wound areas measurement of the different groups of rats.
Table 4. Collagen amount in different experimental animal groups.