Figures & data
Figure 1. Griflola frondosa (GF) and Pleurotus ostreatus (PO). (A) Griflola frondosa (GF). (B) Pleurotus ostreatus (PO).
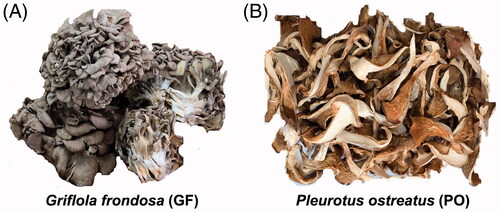
Figure 2. Experimental schedule. Mice were acclimatized for at least 1 week. Four independent cohorts of animals were used to test the antidepressant effects of Griflola frondosa (GF). After the animals received the GF-containing food for 24 h, the 1st animal behavioural tests were performed 60 min after drugs or vehicle were administered. The 1st independent cohort of animals underwent the tail suspension test (TST) on the 1st day, open field test (OFT) on the 3rd day and forced swim test (FST) on the 5th day. To confirm the antidepressant effects of GF, the 2nd independent cohort of animals was subjected to the FST on the 1st day and to the TST on the 5th day under similar conditions. The 3rd independent cohort of animals was used to test the antidepressant effects of GF are unique among commonly used medical mushrooms after 1 day treatment in the TST and FST on the 5th day. The 4th independent cohort of animals was used to test whether the α-amino-3-hydroxy-5-methyl-4-isoxazole-propionic acid (AMPA) receptor-specific antagonist GYKI 52466 (GYKI) was involved in the antidepressant effects of GF in the TST.
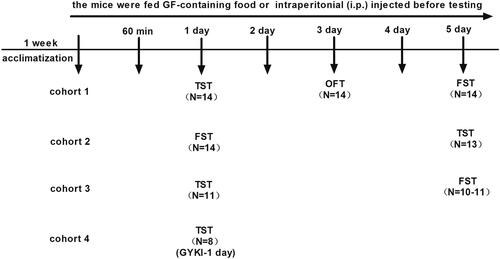
Figure 3. Griflola frondosa (GF) demonstrated significant antidepressant effects in the tail suspension test (TST). CD-1 mice were fed with regular mouse chow, a low dose of Griflola frondosa (GF powder:mouse chow =1:4, GF-L); a medium dose of Griflola frondosa (GF powder:mouse chow =1:2, GF-M); or a high dose of Griflola frondosa (GF powder:mouse chow =1:1, GF-H). For the positive control group, mice were i.p. injected with imipramine (15 mg/kg/day, IMI). Mice in the negative control group were i.p. injected with saline (Sal). One day or five days after the GF-treated food intake, mice were subjected to the TST. The number of mice per group is indicated in each individual graph. Data were analysed by one-way ANOVA and presented as the mean ± SE (post hoc Tukey’s test, *p < 0.05, **p < 0.01, ***p < 0.001). (A) One day after the administration, GF treatment significantly reduced the immobility time in the TST. (B) Five days after the GF administration, GF again significantly reduced the immobility time in the TST.
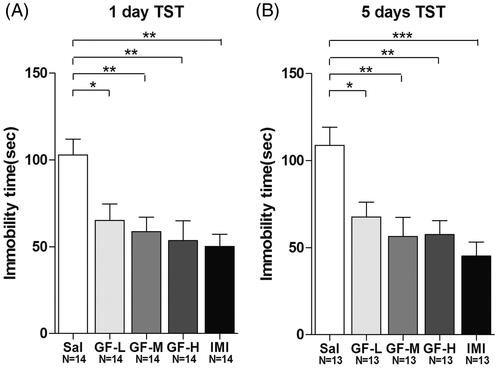
Figure 4. Griflola frondosa (GF) treatment demonstrated significant antidepressant effects in the forced swim test (FST). CD-1 mice were fed with their regular mouse chose, a low dose of Griflola frondosa (GF powder:mouse chow =1:4, GF-L); a medium dose of Griflola frondosa (GF powder:mouse chow =1:2, GF-M); or a high dose of Griflola frondosa (GF powder:chow food =1:1, GF-H). For the positive control group, mice were i.p. injected with imipramine (15 mg/kg/day, IMI). Mice in the negative control group were i.p. injected with saline (Sal). One day or five days after the GF-containing food intake, mice were subjected to the FST. The number of mice per group is indicated in each individual graph. Data were analysed by one-way ANOVA and presented as the mean ± SE (post hoc Tukey’s test, *p < 0.05, **p < 0.01, ***p < 0.001). (A) One day after the administration, GF treatment significantly reduced immobility time in the FST. (B) Five days after the GF administration, GF also significantly reduced immobility time in the FST.
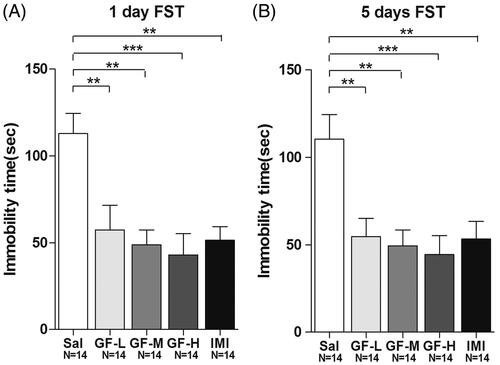
Figure 5. Open field test (OFT) after 3 days of treatment with Griflola frondosa (GF). CD-1 mice were fed with their regular mouse chow, a low dose of Griflola frondosa (GF powder:mouse chow =1:4, GF-L); a medium dose of Griflola frondosa (GF powder:mouse chow =1:2, GF-M); or a high dose of Griflola frondosa (GF powder:mouse chow = 1:1, GF-H). For the positive control group, mice were i.p. injected with imipramine (15 mg/kg/day, IMI). Mice in the negative control group were i.p injected with saline (Sal). After 3 days of treatment with GF-containing food, mice were subjected to the OFT. Total distance travelled and the distance travelled in the centre area were determined by an automated tracking system. The number of mice per group is indicated in each individual graph. Data were analysed by one-way ANOVA and presented as the mean ± SE. (A) The total distance travelled in the field after GF treatment. (B) The distance travelled in the centre area of field after GF treatment.
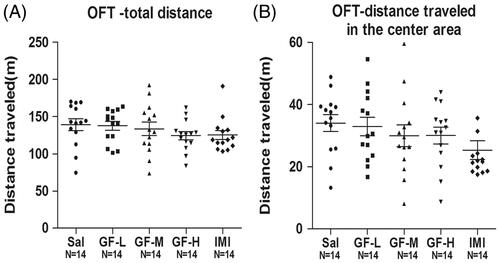
Figure 6. Increased food intake and normal body weight after GF-containing food administration for five days. CD-1 mice were fed with their regular mouse chow, a low dose of Griflola frondosa (GF powder:mouse chow =1:4, GF-L); a medium dose of Griflola frondosa (GF powder:chow food =1:2, GF-M); or a high dose of Griflola frondosa (GF powder:mouse chow =1:1, GF-H). For the positive control group, mice were i.p. injected with imipramine (15 mg/kg/day, IMI). Mice in the negative control group were i.p injected with saline (Sal). After 5 days of drug administration, the amount of food intake and the body weight were measured. Data were analyzed by one-way ANOVA and presented as the mean ± SE (post hoc Tukey’s test, *p < 0.05, **p < 0.01, ***p < 0.001). (A) The food intake of mice for the GF-containing food. (B) The actual amount of GF intake of mice for the different dosages. (C) Body weights of the mice after 5 days of GF-containing food treatment.
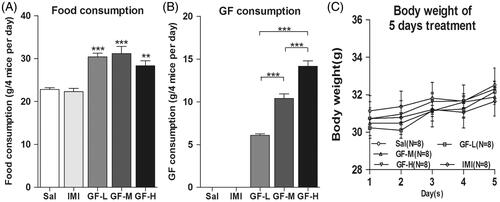
Figure 7. The antidepressant effects of Griflola frondosa (GF) are stronger than that of Pleurotus ostreatus (PO). CD-1 mice were fed with their regular mouse chow, a medium dose of GF-containing food (GF powder:mouse chow = 1:2), or a medium dose of Pleurotus ostreatus (PO) (PO powder:mouse chow = 1:2). For the positive control group, mice were i.p. injected with imipramine (15 mg/kg/day, IMI). Mice in the negative control group were i.p. injected with saline (Sal). After one day of drug administration, mice were subjected to the TST; and after 5 days of drug administration, mice were subjected to the FST. The number of mice per group is indicated in each individual graph. Data were analysed by one-way ANOVA and presented as the mean ± SE (post hoc Tukey’s test, *p < 0.05, **p < 0.01, ***p < 0.001; two-tail t-test, #p < 0.05, ##p < 0.01). (A) After one day of treatment, GF significantly reduced immobility time in the TST but PO did not. (B) After 5 days of treatment, GF significantly reduced immobility time in the FST, but PO did not.
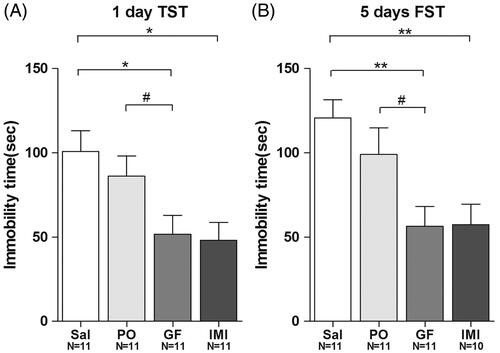
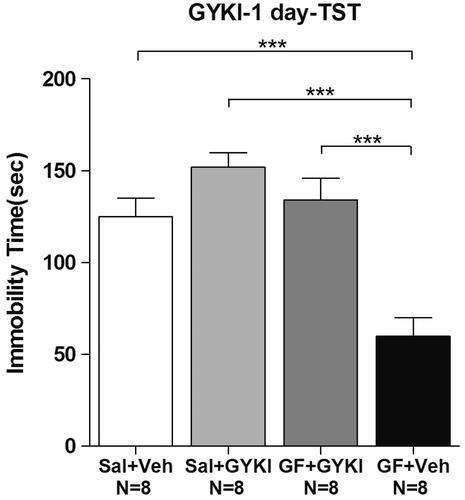
Figure 8. The α-amino-3-hydroxy-5-methyl-4-isoxazole-propionic acid (AMPA) receptor-specific antagonist GYKI 52466 (GYKI) significantly blocked the Griflola frondosa (GF)-induced antidepressant effects in the tail suspension test (TST). CD-1 mice were fed mouse chow with a medium dose of GF (GF powder:mouse chow =1:2) or saline (Sal) for 1 day. On the second day, the mice were treated again with GF, and 60 min after GF treatment, GYKI 52466 (15 mg/kg) or vehicle (Veh) was administered 30 min prior to behavioural testing. Then, the CD-1 mice were subjected to the TST. Immobility time were determined. The number of mice per group is indicated in each individual graph. Data were analyzed by one-way ANOVA and presented as the mean ± SE (post hoc Tukey’s test, *p < 0.05, **p < 0.01, ***p < 0.001).