
Figures & data
Figure 1. The effect of beetroot on the viability of non-irradiated or irradiated splenocytes. Cell viability of splenocytes treated with beetroot extract at various concentrations (0–1000 μg/mL) and incubated for 72 hours was measured by using the MTT assay. (a) Non-irradiated splenocytes, (b) splenocytes irradiated with 1.5 Gy γ-rays (††p < .01).
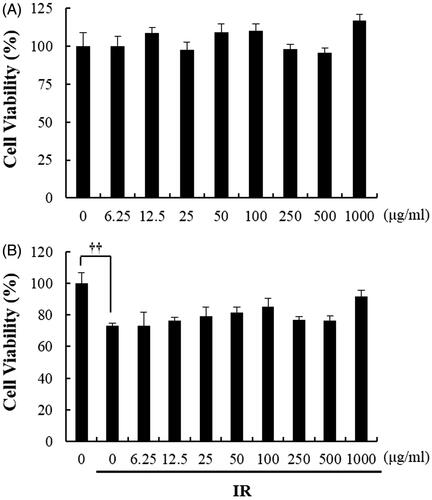
Figure 2. The effect of beetroot on the proliferation of irradiated splenocytes. Splenocytes irradiated with 1.5 Gy γ-ray irradiation were cultured in the presence of beetroot extract at various concentrations (0–1000 μg/mL) for 72 h and cell proliferation was measured using the 3H-thymidine incorporation assay. Data shown are representative of three independent experiments. Proliferative responses were assessed in triplicate for each experiment. Data are represented as means ± SEM of radioactivity-count per minute (cpm) (†p < .05, **p < .01).
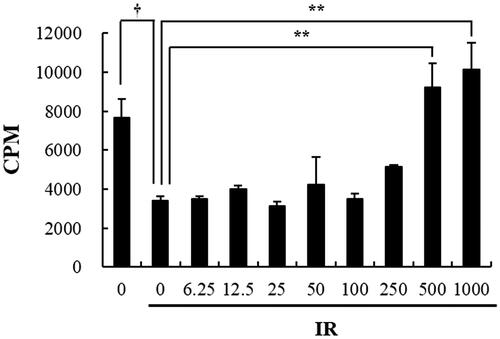
Figure 3. The effect of beetroot on DNA damage caused by γ-ray irradiation in splenocytes, as measured with the alkaline comet assay. Splenocytes were isolated from mice of each experiment group 10 days after 7 Gy WBI. Data shown are representative of three independent experiments. (a) Naive group, (b) IR group, (c) IR + Beetroot group, (d) percentage of tail DNA, (e) olive tail movement, (f) tail length in each group, scored according to the Komet 5.5 program. Bars in (a)–(c) represent 30 μm. Each criteria was calculated in 100 cells per mouse. Data are expressed as mean ± SEM (*, †p < .05, **p < .01).
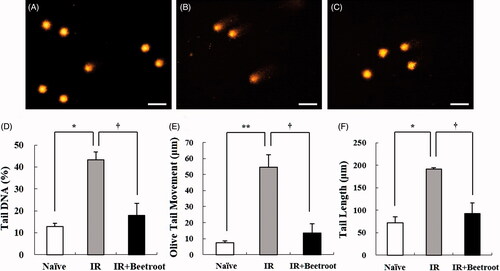
Figure 4. The effect of beetroot on the proliferation of splenocytes. Mice administered with beetroot extract were exposed to 7 Gy WBI and splenocytes were isolated from mice in experiment groups 10 days after irradiation. Proliferation of splenocytes was measured using the incorporation of 3H-thymidine. Data shown are representative of three independent experimnets and are represented as means ± SEM of radioactivity-count per minute (cpm) (*p < .05, ††p < .01).
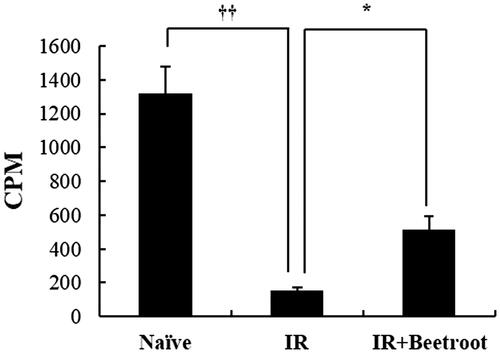
Figure 5. The effect of beetroot on the depletion of bone marrow cells induced by 7 Gy irradiation. (a–f) Representative images of H&E stained longitudinal sections from the femurs of (a, b) Naive, (c, d) IR and (e, f) IR + Beetroot groups on day 10 after WBI are shown. Bars =100 μm (a, c, e) and 50 μm (b, d, f). (g) Bone marrow cells were isolated from both femurs of mice of each experimental group 10 days after irradiation and counted in a haemacytometer under an optical microscope. Data are represented as means ± SEM of three independent experiments (*, †p < .05).
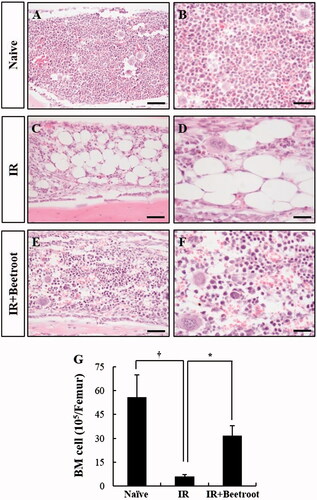
Figure 6. The effect of beetroot on the cells committed to hematopoiesis of bone marrow in irradiated mice. Mice administered with beetroot extract were exposed to 7 Gy irradiation and bone marrow cells of femurs were isolated from mice of each experiment group 10 days after irradiation. (a) Cell cycle of bone marrow cells of irradiated mice. Fluorescence-activated cell sorting determined the portion of bone marrow cells in the sub-G1 phase (apoptotic peak) of the cell cycle. (b–d) Representative images of Ki-67 immunoperoxidase staining in the femurs of (b) Naive, (c) IR and (d) IR + Beetroot groups. Bars =50 μm. (e–g) Representative images of immunoperoxidase staining of c-kit in the femurs of (e) non-irradiated, (f) irradiated and (g) IR + Beetroot groups. Bars =50 μm. (H-I) Quantification of (h) Ki-67 and (I) c-kit positive cells performed using five lesions showing the most representative expression of each mouse (3 mice per group). Data are represented as means ± SEM of three independent experiments (*p < .05, **,††p < .01, ***,†††p < .001).
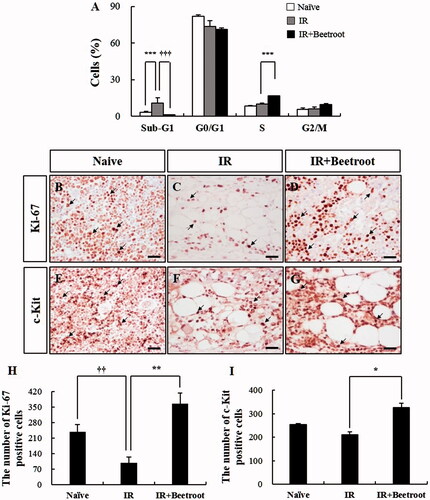
Figure 7. The effect of beetroot on the proliferation of bone marrow cells of irradiated mice. Bone marrow cells isolated from mice of each experimental group were cultured in methylcellulose medium for 10 days after irradiation and colonies of BFU-E, CFU-M, CFU-G, CFU-GM, CFU-GEMM were counted at 10 days after incubation. Data are shown as the mean ± SEM of three independent experiments (***p < .001).
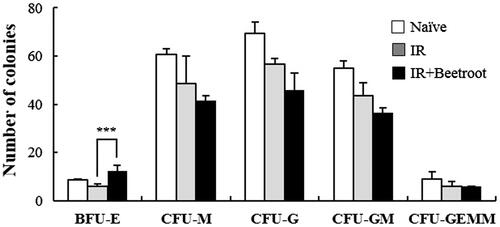
Figure 8. The effect of beetroot on cytokine production in splenocytes and bone marrow cells. Splenocytes and bone marrow cells were isolated from mice of each experiment group at 10 days after irradiation and seeded onto 96-well microtiter plates. After 48 h of incubation, the levels of GM-CSF and IL-3 were measured in culture supernatants. Data are represented as means ± SEM of three independent experiments. (a) IL-3 production level in splenocytes, (b) GM-CSF production level in splenocytes, (c) IL-3 production level in bone marrow cells, (d) GM-CSF production level in bone marrow cells (*p < .05).
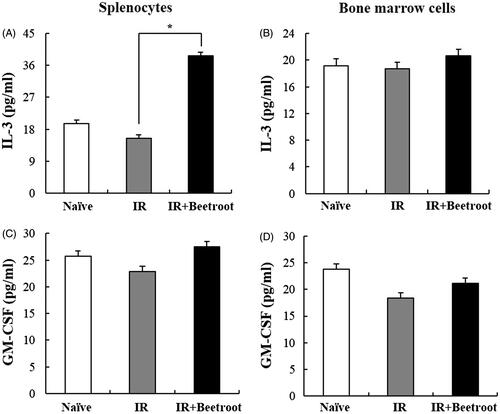
Figure 9. The effect of beetroot on peripheral blood in mice of each experimental group. Whole blood of each mouse was collected in EDTA-2K coated blood collection tubes and analyzed by a blood cell counter at 10 days after irradiation. Data are represented as means ± SEM of three independent experiments. (a) RBC count (106/μL), (b) WBC count (103/μL), (c) HCT level (%), (d) HGB level (g/dl) (*p < .05, †††p < .001). ND: not detected.
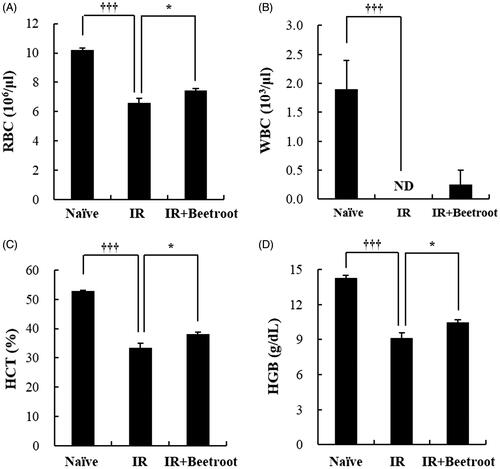
Figure 10. The effect of beetroot on the survival of lethally irradiated mice. Data shown are the cumulative values from three independent experiments. Numbers inserted below the percentages indicate the total number of mice in each group.
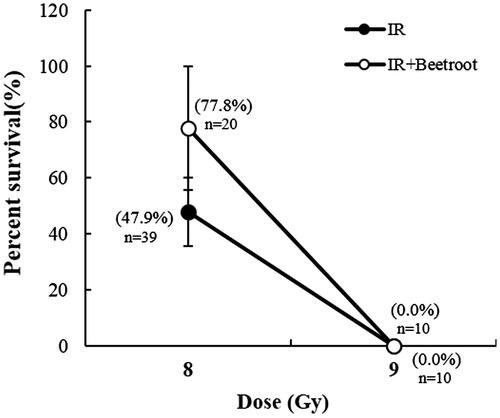
Table 1. The radioprotective effect of beetroot extract on lethally irradiated mice. Mice received the beetroot diet or control diet for 14 days before and after WBI, and were observed for survival during 30 days after WBI.