
Figures & data
Figure 1. Structures of lyoniside (1) and lyoniresinol (2).
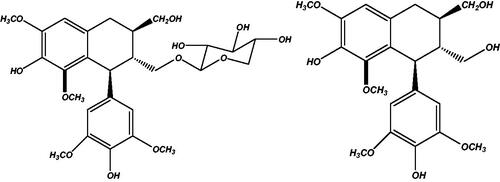
Figure 2. UV spectra for lyoniside and lyoniresinol.
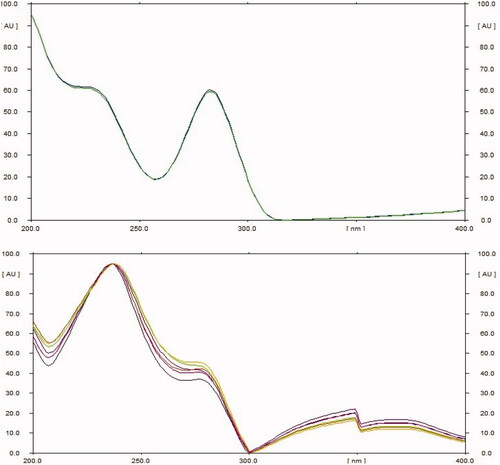
Figure 3. (a) Mass spectra for lyoniside. (b) Mass spectra for lyoniresinol.
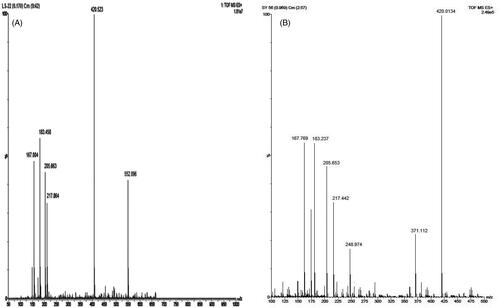
Figure 4. (a) NMR spectra for lyoniside. (b) NMR spectra for lyoniresinol.
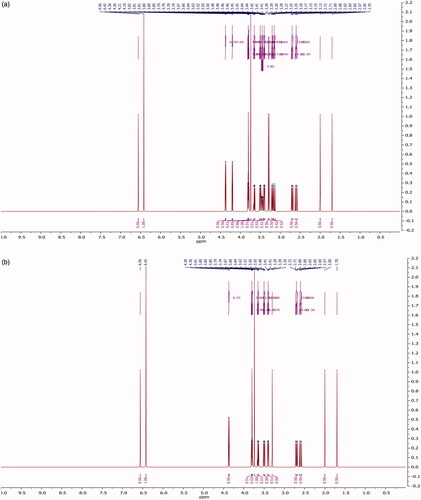
Table 1. Validation parameters for lyoniside and lyoniresinol.
Table 2. Intra- and inter-day precision for lyoniside and lyoniresinol.
Table 3. Robustness studies for lyoniside and lyoniresinol.
Table 4. Accuracy as recovery studies for lyoniside and lyoniresinol.
Figure 5. HPTLC chromatograms for aqueous extract and biotransformed extract (2–8 days).
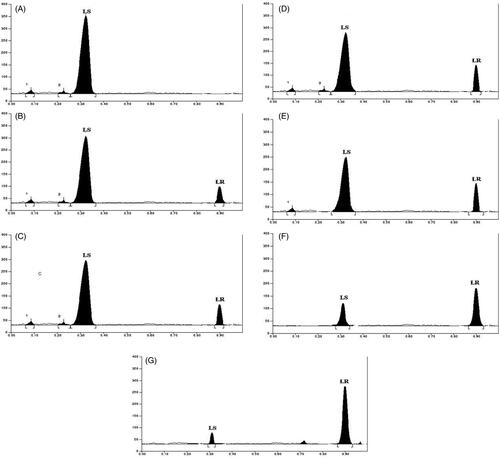
Table 5. Quantification of lyoniside and lyoniresinol in aqueous extract and biotransformed product.