Figures & data
Figure 1. Compound 1, thermal ellipsoid are drawn at 50% probability, showing all hydrogen atoms.
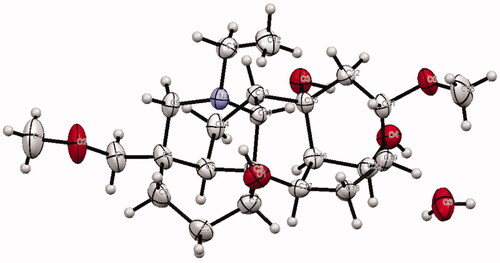
Table 1. Data related to structure determination and refinement of compound 1.
Table 2. List of selected bond lengths (Å) and bond angle (o) of compound 1.
Figure 2. HOMO-LUMO of compound 1 calculated at B3LYP/6-31 + G (p).
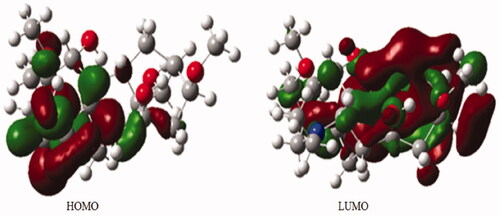
Table 3. Energy parameters of the compound 1.
Figure 3. (A) Acetylecholinesterase inhibition by compound 1 is the Lineweaver–Burk plot of reciprocal of initial velocities versus reciprocal of four fixed substrate concentrations in absence (•) and presence of 100 μM (▪), 75 μM (▴), 50 μM (×) of compound 1. (B) Butyrylecholinesterase inhibition by 1 in absence (•) and presence of 100 μM (▪), 75 μM (▴), 50 μM (×) of compound 1.
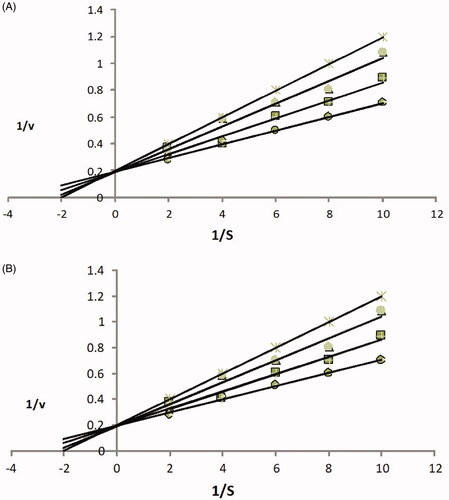
Table 4. AChE and BChE inhibitory activities of compound 1 (isotalatizidine hydrate).
Figure 4. Structure of compound 1, orientation of different rings and groups are shown.
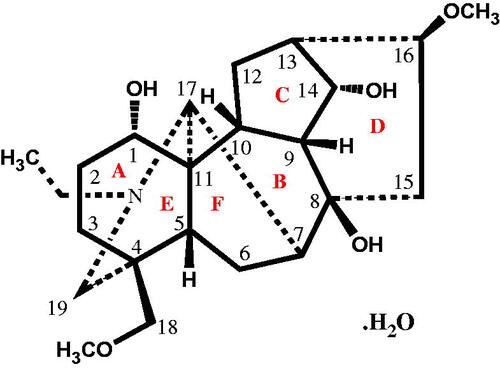
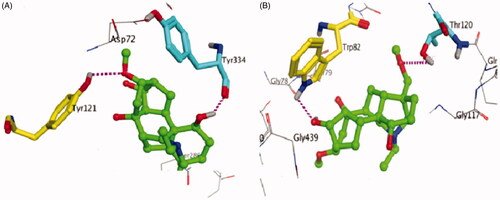
Figure 5. 3D binding mode of compound 1 as competitive inhibitor of AChE and BChE.