
Figures & data
Figure 1. The anti-proliferative effect of C. nutans root extracts. Treatments were performed on (a) MCF-7, (b) HeLa and (c) 3T3 cells for three days. Data represent three independent experiments performed in triplicate. Asterisks denote differences with statistical significances compared to untreated cells (*, ** and *** represent p < 0.05, p < 0.005 and p < 0.0005 respectively). p-values were obtained from a two-tailed t-test.
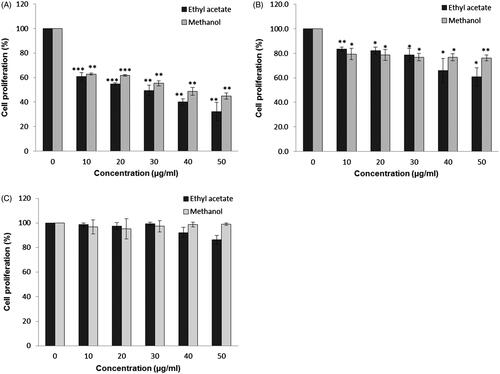
Figure 2. Morphological changes caused by C. nutans extracts on MCF-7. Cells were treated with (a) ethyl acetate and (b) methanol root extracts of C. nutans at their respective IC50 value for up to three days. Cells were stained with methylene blue and observed under microscope with 40x magnification. Arrows indicate some cells with morphological changes when compared with untreated cells.
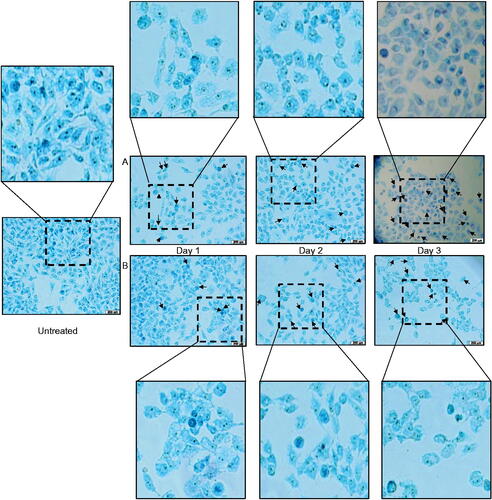
Figure 3. Apoptotic effects of C. nutans root extracts on MCF-7 cells. Cells were treated with C. nutans root extracts and camptothecin for three days at the indicated concentrations. Data represent three independent experiments performed in triplicate. Asterisks denote differences with statistical significances compared to untreated cells (*, ** and *** represent p < 0.05, p < 0.005 and p < 0.0005 respectively). p-values were obtained from a two-tailed t-test.
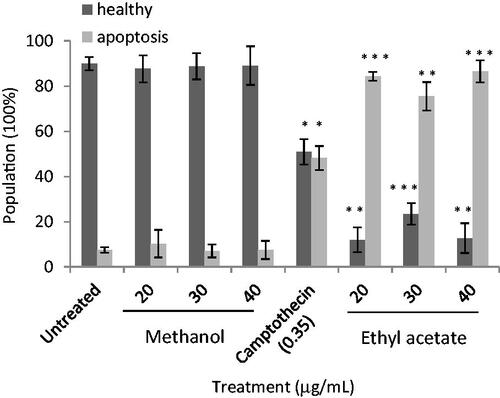
Figure 4. The effect of C. nutans root extracts on the expression of ACTB (a), BCL2 (b) and BAX (c) in MCF-7 breast cancer cell line by RT-PCR. Lane 1: 100 bp DNA marker, lane 2: negative control, lane 3: without treatment, lane 4: methanol root extract and lane 5: acetyl acetate root extract.
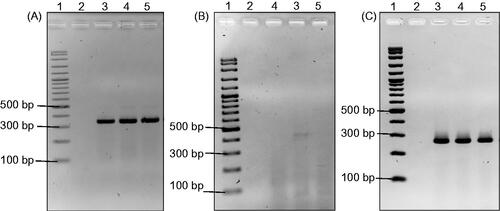
Figure 5. GC-MS chromatogram of ethyl acetate root extract of C. nutans.
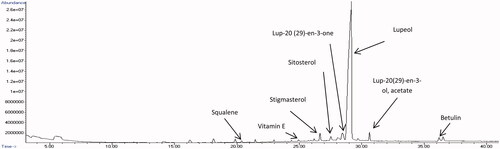
Figure 6. GC-MS chromatogram of methanol root extract of C. nutans.
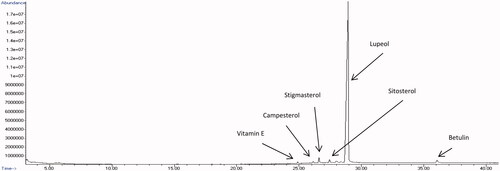
Table 1. Cytotoxic compounds identified in the ethyl acetate root extract of C. nutans.
Table 2. Cytotoxic compounds identified in the methanol root extract of C. nutans.