Figures & data
Figure 1. Infrared spectra of the sapogenin and iron–sapogenin.
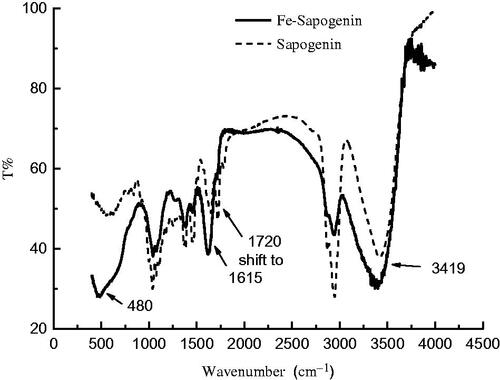
Table 1. Elemental analysis and mass percentage of metallic elements in the sapogenin and iron–sapogenin.
Figure 2. TG/DTG curves of the (a) sapogenin and (b) iron–sapogenin.
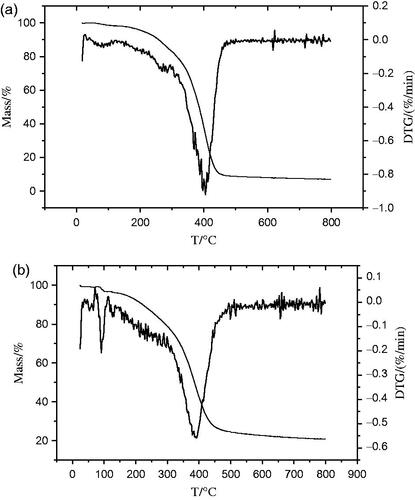
Figure 3. The scheme of iron–sapogenin synthesis from the sapogenin.
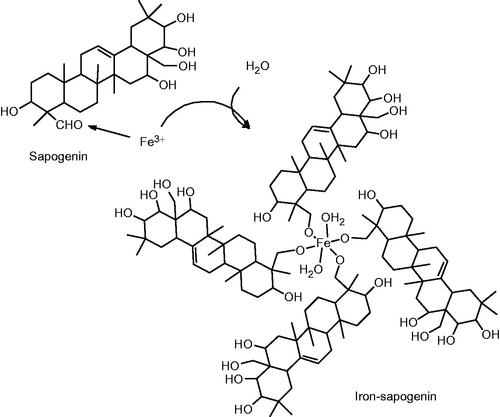
Figure 4. Scanning electron micrograph of iron–sapogenin at 20,000 × amplification.
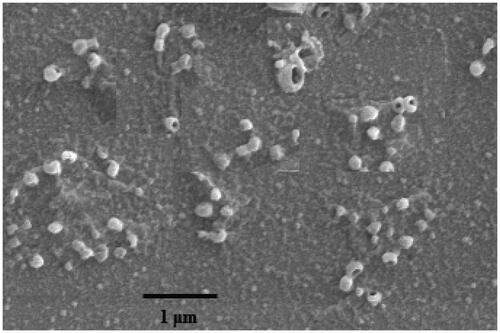
Figure 5. DPPH radical scavenging activity of the sapogenin and iron–sapogenin at different concentration. Data are means of three determinations ± SD. **p < 0.01, compared to the sapogenin.
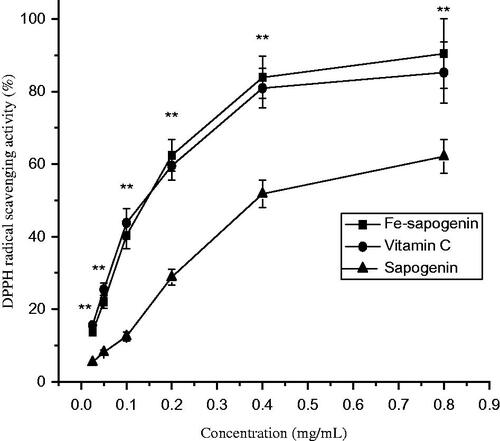
Table 2. Effect of the sapogenin and iron–sapogenin on behaviour, antioxidant levels and neurotransmitters in brain of mice.
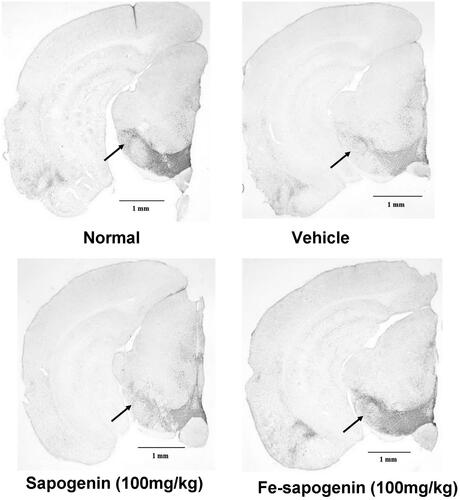
Figure 6. Tyrosine hydroxylase (TH) immunohistochemistry of substantia nigra sections in mice with different treatments. The photos were taken by camera in 50× magnification.