Figures & data
Figure 1. Chromatographic profiles of the ethanolic extract of rosemary recorded at two UV wavelengths: (a) 280 nm, (b) 254 nm.
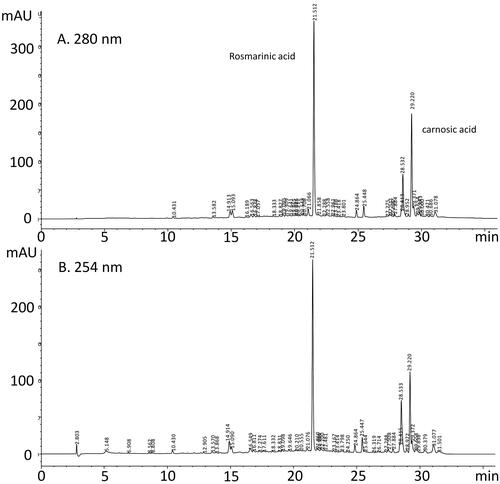
Table 1. Total polyphenol contents (TPC) expressed in mg equivalent gallic acid (GAE.g-1 DW), total flavonoid contents (TFC), condensed tannin contents (CTC) expressed in mg equivalent catechin (CE/g DW) and antioxidant activity of Rosmarinus officinalis leaves extract against DPPH radical expressed in IC50 value and iron reducing power (FRAP) expressed in EC50 value.
Figure 2. Effect of rosemary extract (RO) on bleomycin-induced lipid peroxidation in lung. Results are expressed as means ± S.D. (n = 10), ***p < 0.001 vs C, ##p < 0.01 vs BLM, ###p < 0.001 vs BLM.
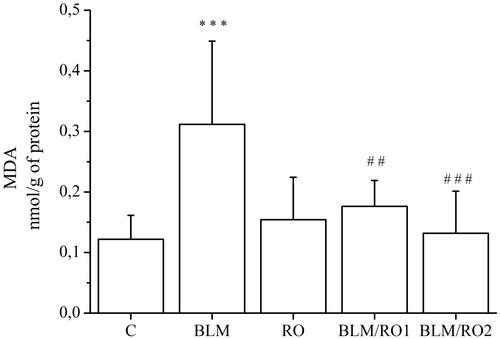
Figure 3. Effect of rosemary extract (RO) on bleomycin-induced changes in catalase activity in lung. Results are expressed as means ± S.D. (n = 10), *p < 0.05 vs C, #p < 0.05 vs BLM, ##p < 0.01 vs BLM.
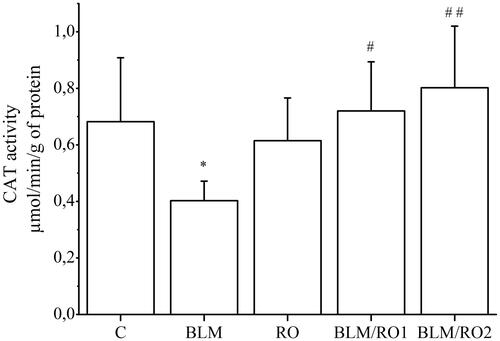
Figure 4. Effect of rosemary extract (RO) on bleomycin-induced changes in glutathione-S-transferase and thiols group levels in lung. Results are expressed as means ± S.D. (n = 10), ***p < 0.001 vs C, **p < 0.01 vs. C, ##p < 0.01 vs BLM, #p < 0.05 vs. BLM.
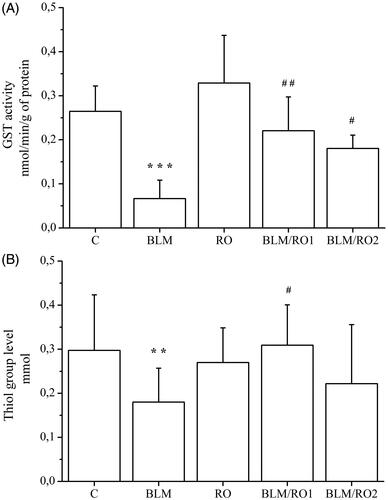
Table 2. Body weight variations.
Table 3. Fibrosis score.
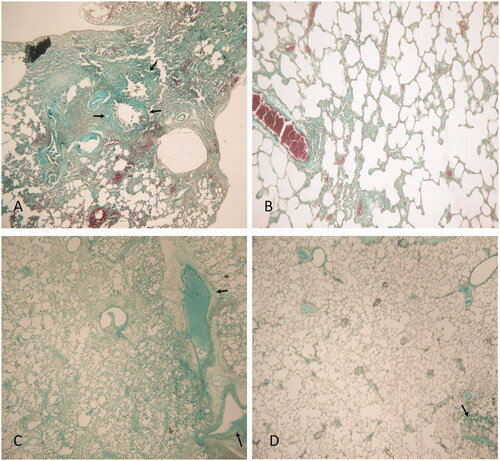
Figure 5. Histopathological findings (H&E) × 100 in lung tissue. (A) BLM, arrows indicate a thickening of interalveolar septum and formation of fibrous mass, asterisk indicates severe inflammation with the presence of large follicles which replace the parenchyma; (B) RO; (C) BLM/RO1, arrows point to a considerable interstitial thickening, but not that of alveolar walls; (D) BLM/RO2, arrows indicate slightly thickened walls without an apparent impairment to lung architecture. One representative example is shown for each group.
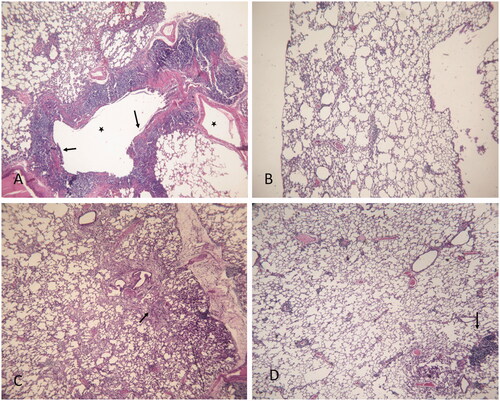
Figure 6. Histopathological findings (Masson’s trichrome) × 100 in lung tissue. BLM (A), RO (B), BLM/RO1 (C), BLM/RO2 (D). Arrows indicate condensed bundles of collagen. One representative example is shown for each group.