
Figures & data
Table 1. The blood glucose and serum insulin concentrations of the rats after the blood glucose levels were stably maintained for one week.
Figure 1. The mass spectra of (a) berberine (b) and IS.
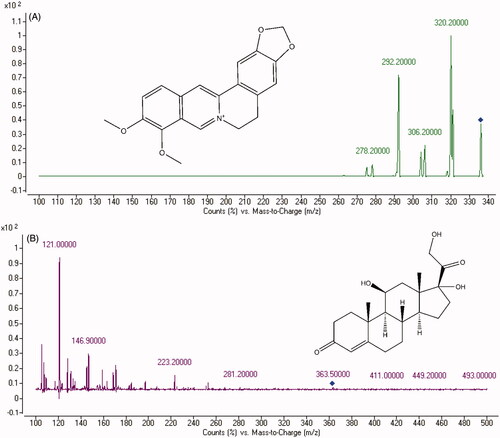
Figure 2. Chromatograms of (a) blank plasma, and (b) plasma spiked with berberine and IS. B1: Berberine; B2: IS.
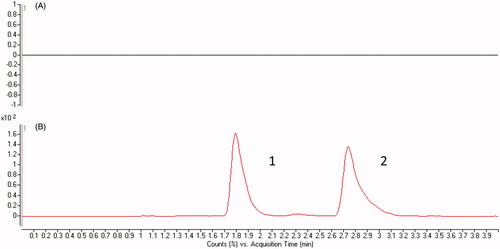
Table 2. The intra-day and inter-day precision and accuracy of berberine in plasma samples.
Table 3. Stability of berberine in plasma samples (n = 3).
Figure 3. The pharmacokinetic profiles of berberine in rats after oral administration of berberine in normal group and T2DM model group.
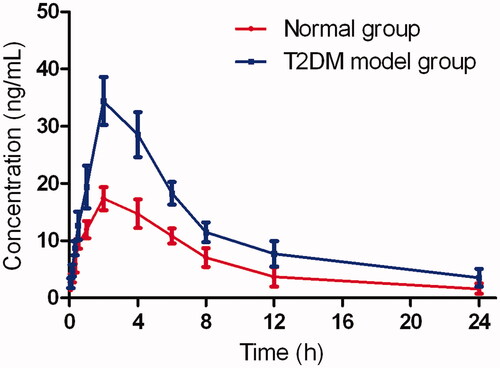
Table 4. Pharmacokinetic parameters of berberine in rats after oral administration of berberine to normal rats and T2DM model rats (20 mg/kg; n = 6, Mean ± S.D.).