Figures & data
Table 1. Body weights in control rats, diabetic rats (DM), diabetic rats that treated with garlic extract (DM + AGE) and normal rats that received garlic extract (AGE).
Table 2. Glucose levels in control rats, diabetic rats (DM), diabetic rats that treated with garlic extract (DM + AGE) and normal rats that received garlic extract (AGE).
Table 3. Urea, creatinine and uric acid levels in control rats, diabetic rats (DM), diabetic rats that treated with garlic extract (DM + AGE) and normal rats that received garlic extract (AGE) at the end of experiment time.
Figure 1. (A) Malondialdehyde (MDA) and (B) total oxidative status (TOS) levels in the kidney tissues of control rats, diabetic rats (DM), diabetic rats that treated with garlic extract (DM + AGE) and normal rats that received garlic extract (AGE). Results are mean ± SD (n = 6). ***p < 0.001 compare with control; ††p < 0.01 and †††p < 0.001 compare with DM.
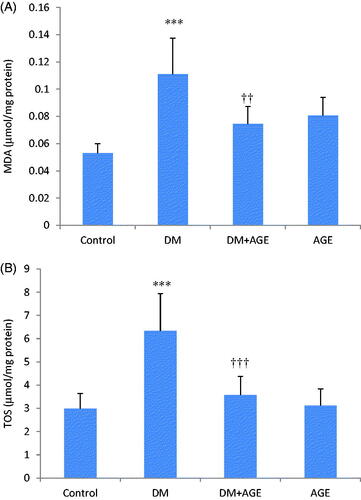
Figure 2. Nitrite levels in the kidney tissues of control rats, diabetic rats (DM), diabetic rats that treated with garlic extract (DM + AGE) and normal rats that received garlic extract (AGE). Results are mean ± SD (n = 6). ***p < 0.001 compare with control; ††p < 0.01 compare with DM.
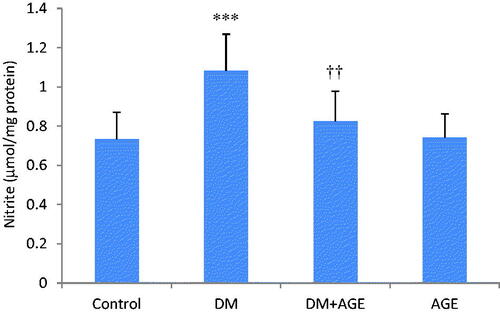
Figure 3. mRNA changes of tumour necrosis factor-alpha (TNF-α) in the kidney tissues of control rats, diabetic rats (DM), diabetic rats that treated with garlic extract (DM + AGE) and normal rats that received garlic extract (AGE). Results are mean ± SD (n = 6).
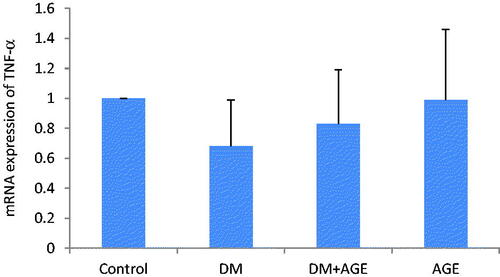
Figure 4. (A) Tumour necrosis factor-alpha (TNF-α) protein levels in the kidney tissues of control rats, diabetic rats (DM), diabetic rats that treated with garlic extract (DM + AGE) and normal rats that received garlic extract (AGE). Results are mean ± SD (n = 6). **p < 0.01 compare with control; ††p < 0.01 compare with DM.
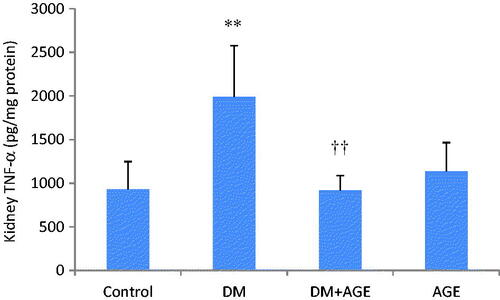
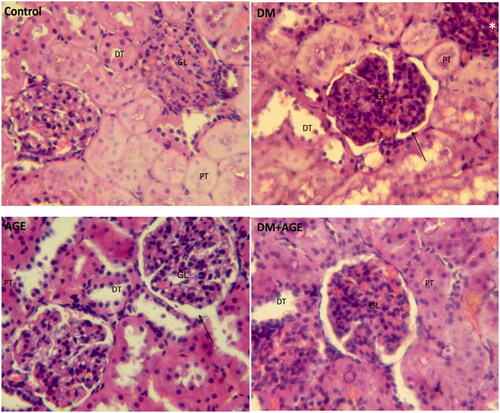
Figure 5. Histological staining with H&E in the kidney tissues of control rats, diabetic rats (DM), diabetic rats that treated with garlic extract (DM + AGE) and normal rats that received garlic extract (AGE). GL: glomerulus, PT: proximal tube, DT: distal tube. *Interstitial inflammation and → Bowman capsule space.