
Figures & data
Figure 1. Chemical structure of isoimperatorin.
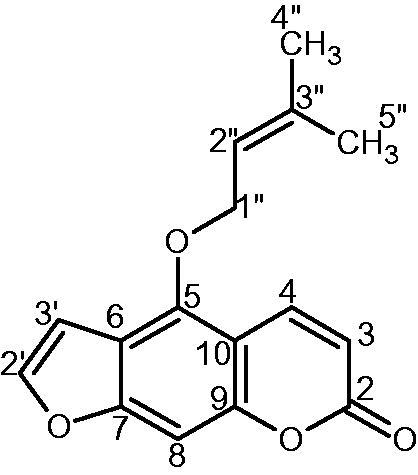
Figure 2. Ortep view of the crystal structure of isoimperatorin.
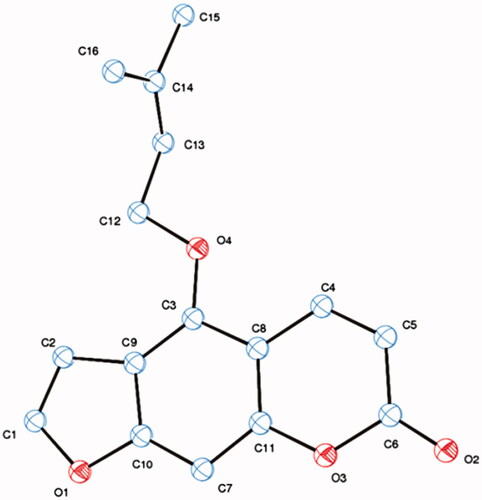
Figure 3. Effect of isoimperatorin on ulcer index for ulcers induced by ethanol, indomethacin, or pylorus ligation. Numbers indicate the % protection with respect to the control groups of different ulcer models. Bars represent the mean ± SEM of each group (n = 5). One-way analysis of variance (ANOVA) was employed and significant differences between control groups and groups treated with isoimperatorin are represented by *p < 0.05 and **p < 0.001. (a) % protection of isoimperatorin in ethanol-induced ulcer model (b) % protection of isoimperatorin in indomethacin induced ulcer model (c) % protection of isoimperatorin in pyloric ligated induced ulcer model
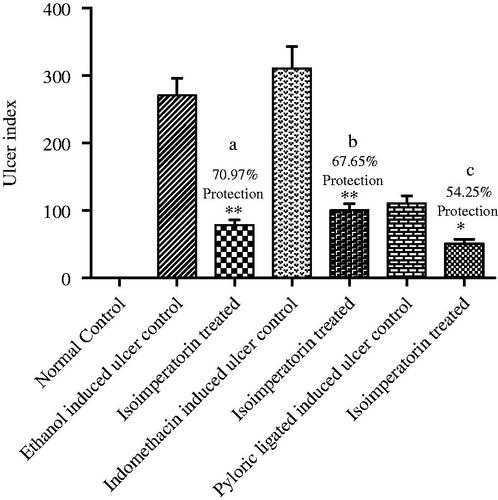
Figure 4. Effect of isoimperatorin treatment on the viability of rabbit articular chondrocytes. Chondrocytes were treated with the indicated concentrations (0.0–737.74 μM) of isoimperatorin for 24 h. Photographs of chondrocytes (A) were taken with a phase-contrast microscope (200× magnification). Cell viability was estimated using the methyl thiazole tetrazolium (MTT) assay. The graphical data (B) are expressed as mean ± standard error of mean.
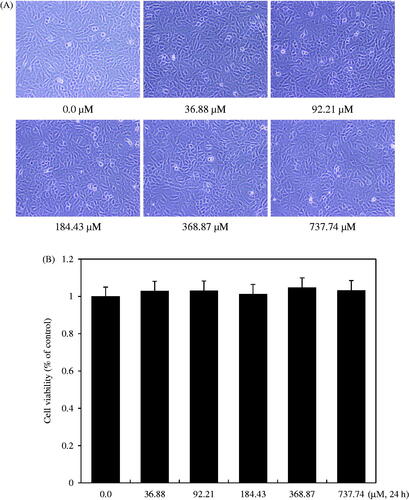
Figure 5. Effect of isoimperatorin on the dose-dependent expression of type II collagen in primary chondrocytes. After the treatment of chondrocytes with indicated concentrations of isoimperatorin for 24 h, (A) type II collagen expression was detected using Western blot analysis. (B) Isoimperatorin increased the expression of type II collagen in primary chondrocytes in the presence or absence of IL-1β. GAPDH was used as the loading control.
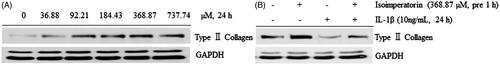
Figure 6. Interactions between isoimperatorin and Jack bean urease (PDB ID 3LA4) at the active site, generated using Discovery studio 2.1.0. The light silver colour shows the backbone of the urease protein in solid ribbon format. Carbon and oxygen atoms of the ligand molecule are shown in green and red, respectively. The interacting residues are shown in blue, while the dotted lines indicate the binding distances (Å).
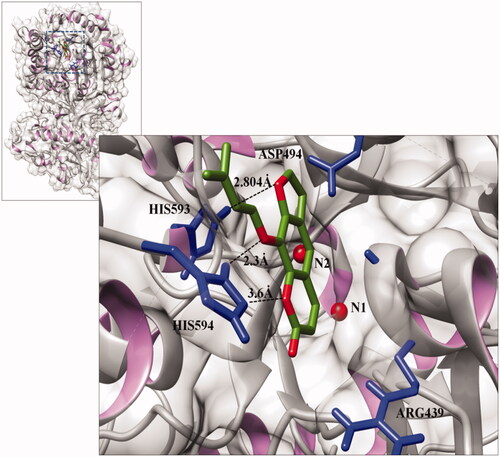
Table 1. Chemo-informatic properties of isoimperatorin.
Table 2. ADMET properties of isoimperatorin.
Table 3. Energy of docked isoimperatorin and urease complex.