
Figures & data
Figure 1. DSC profiles of rat liver nuclei in buffer A: 1 – control; 2 – with Dst (molar ratio Dst/DNA =0.1). I, II, III – designations of thermal transitions.
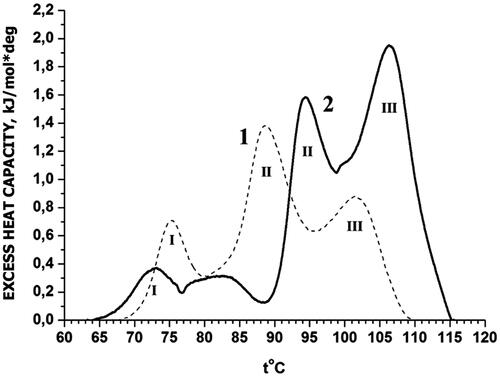
Figure 2. DSC profiles of rat liver nuclei in buffer B: 1 – control; 2 – with Dst (molar ratio Dst/DNA =0.1). I, II, III – designations of thermal transitions.
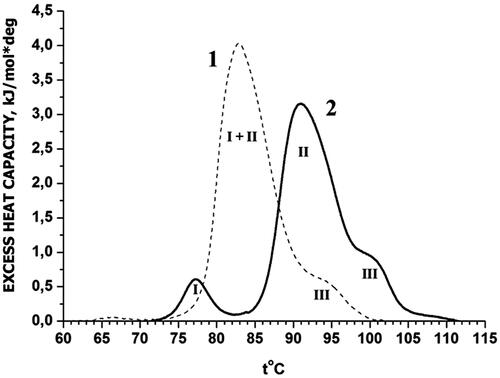
Table 1. Enthalpies of thermal transitions for rat liver nucleiTable Footnotea.