Figures & data
Table 1. Effect of luteolin on motor coordination in rotarod model.
Table 2. Effect of luteolin in PTZ-induced seizure test.
Figure 1. Effect of luteolin on seizure score in PTZ-induced kindling model. The data are expressed as mean ± SEM (n = 10) and were analyzed using one-way analysis of variance (ANOVA) followed by Dunnett’s test. Differences were considered to be statistically significant when *p < 0.05, **p < 0.01, ***p < 0.001 compared to PTZ control.
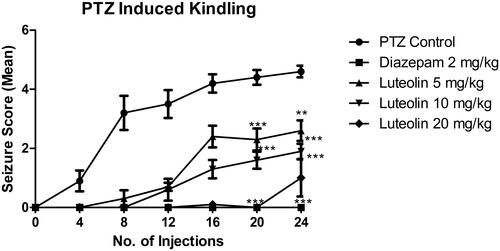
Figure 2. Effect of luteolin on MDA levels in PTZ kindling model. The data are expressed as mean ± SEM (n = 6) and were analyzed using one-way analysis of variance (ANOVA) followed by Dunnett’s test. Differences were considered to be statistically significant when *p < 0.05, **p < 0.01, ***p < 0.001 compared to PTZ control and @p < 0.001 when compared to normal control.
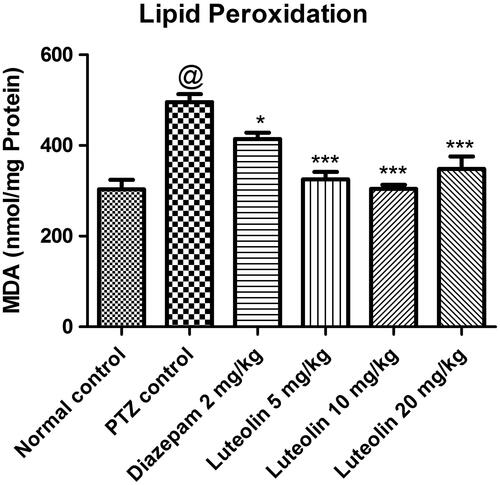
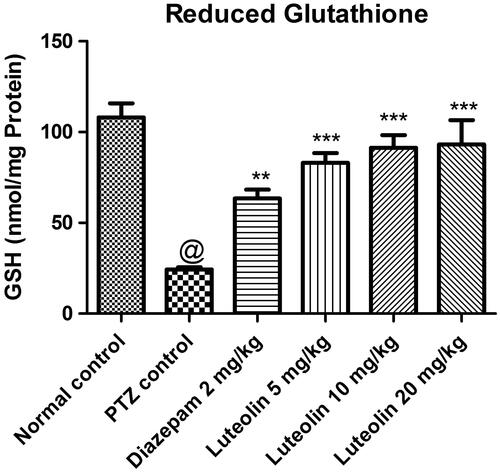
Figure 3. Effect of luteolin on reduced GSH levels in PTZ kindling model. The data are expressed as mean ± SEM (n = 6) and were analyzed using one-way analysis of variance (ANOVA) followed by Dunnett’s test. Differences were considered to be statistically significant when *p < 0.05, **p < 0.01, ***p < 0.001 compared to PTZ control and @p < 0.001 when compared to normal control.