Figures & data
Figure 1. Curcumin plasma concentration after SD17 administration. Representative chromatograms of HPLC separations of (A) septic rat plasma blank, (B) septic rat plasma with curcumin standard and (C) septic rat plasma with SD17. (D) Curcumin levels of animals subjected to sham operation (Sham) or sepsis by caecal ligation and puncture (CLP), pretreated and treated by gavage with SD17 (100 mg/kg). The values shown are means ± SEM. *p < 0.001 compared to group 6 and 24 h. n = 4–7 animals per group. ND: not detectable.
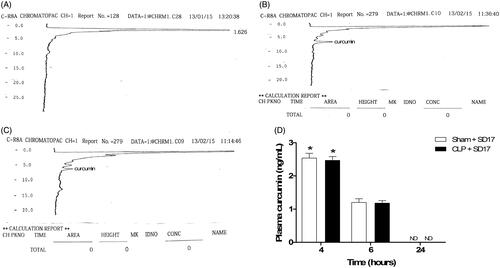
Figure 2. Effect of SD17 treatment on survival rate of septic animals. The animals were treated with SD17 by gavage (100 mg/kg) or water (vehicle) for seven consecutive days and at 2 h after the caecal ligation and puncture (CLP) surgery. Survival analysis was performed by the Log Rank Mantel-Cox test. The values are expressed as percentage of survival rate. The number of animals is shown in parentheses.
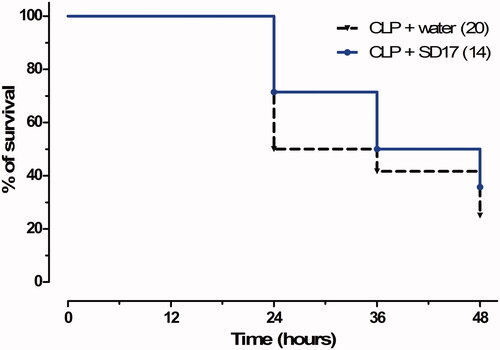
Figure 3. Effect of SD17 treatment on (A) haematocrit and (B) glycaemia levels at 4, 6 and 24 h after Sham or CLP operation. Values shown are means ± SEM. *p < 0.05 compared to the Sham group; +p < 0.05 compared to the same group (i.e., in comparison to the CLP + water and CLP + SD17 groups 4 and 6 h); #p < 0.05 compared to vehicle (water) treatment in the same period and same group (i.e., in comparison to the CLP + water group 24 h). n = 4–11 animals/group.
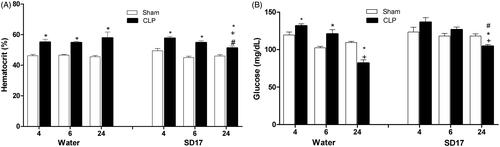
Figure 4. Effect of SD17 treatment on plasma and peritoneal lavage fluid (PLF) concentrations of IL-1β and IL-6 at 4, 6 and 24 h after Sham or CLP surgery. Concentration of (A) IL-1β and (C) IL-6 in plasma and (B) IL-1β, and (D) IL-6 the PLF animals subjected to sham operation (Sham) or sepsis induced by caecal ligation and puncture (CLP), pretreated and treated by gavage with SD17 (100 mg/kg) or vehicle (water). The values shown are means ± SEM. *p < 0.001 compared to the Sham group; +p < 0.001 compared to the same group; #p < 0.05 compared to vehicle (water) treatment in the same period and same group. n = 4–11 animals/group. ND: not detectable.
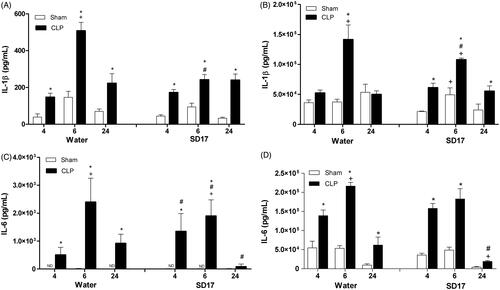
Figure 5 - Effect of SD17 treatment on plasma nitrate levels at 4, 6 and 24 after Sham or CLP operation. Values shown are means ± SEM. *p < 0.05 compared to the Sham group; +p < 0.05 compared to the same group (i.e., in comparison to the CLP + water groups 6 and 24 hand CLP + SD17 groups 4 and 6 h); #p < 0.001 compared to vehicle (water) treatment in the same period and same group (i.e., in comparison to the CLP + water group 24 h); n = 3–10 animals/group.
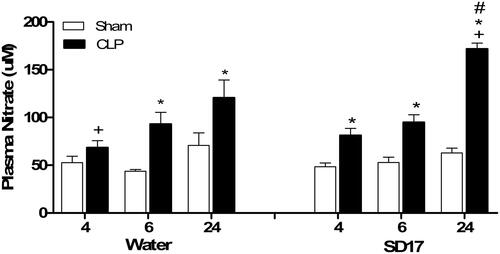
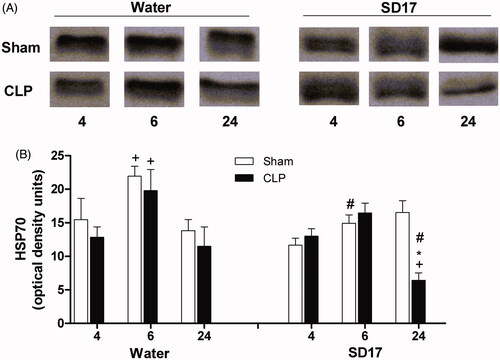
Figure 6. Effect of SD17 treatment on serum HSP70 levels at 4, 6 and 24 h after Sham or CLP operation. (A) Representative western blots were analyzed for each group and time point. (B) HSP70 values shown are means ± SEM. *p < 0.05 compared to the Sham group; +p < 0.05 compared to the same group; #p < 0.01 compared to vehicle (water) treatment in the same period and group (i.e., in comparison to the Sham + water group 6 h and CLP + water group 24 h). n = 3–8 animals/group.