Figures & data
Figure 1. Effect of preemptive treatment of chicks with AZE (30–300 mg/kg; p.o.) and diclofenac (10–100 mg/kg, i.p.) on time course curves (a, c) and the total oedema response (b, d) in carrageenan-induced foot oedema. Values are means ± S.E.M. (n = 6). *p < 0.05; **p < 0.01; ***p < 0.001 compared to vehicle-treated group (Two-way ANOVA followed by Tukey’s multiple comparison test). †p < 0.05; ††p < 0.01; †††p < 0.001 compared to vehicle-treated group (One-way ANOVA followed by Tukey’s multiple comparison test).
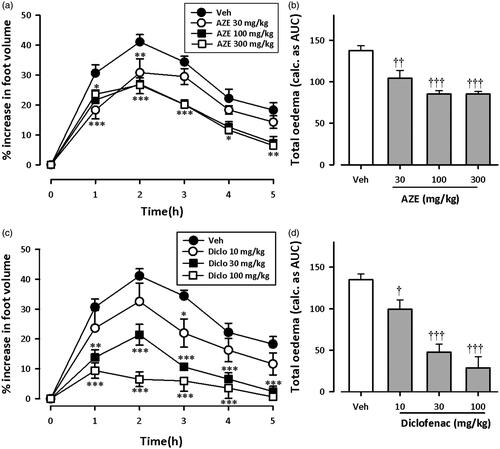
Figure 2. Effect of AZE (30–300 mg/kg, p.o.) and diclofenac (10–100 mg/kg, i.p.) on time-course curves (a, c) and the total oedema response (b, d) in the curative protocol of carrageenan-induced foot oedema in chicks. Values are means ± S.E.M. (n = 6). *p < 0.05; **p < 0.01; ***p < 0.001 compared to vehicle-treated group (Two-way ANOVA followed by Tukey’s multiple comparison test). †p < 0.05; ††p < 0.01; †††p < 0.001 compared to vehicle-treated group (One-way ANOVA followed by Tukey’s multiple comparison test).
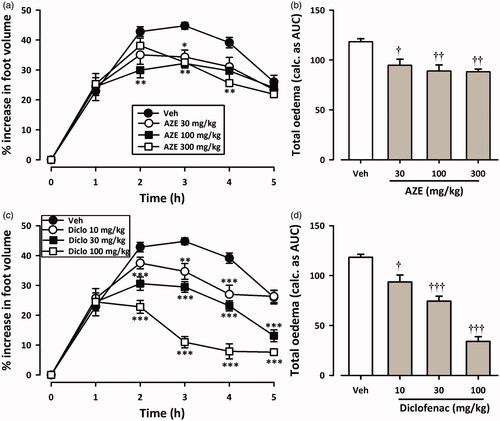
Figure 3. Effect of AZE (30–300 mg/kg, p.o.) and paracetamol, PMOL (150 mg/kg, p.o.) on time-course curve (a) and the total change in temperature (calculated as AUCs) (b) on baker’s yeast-induced changes of rectal temperatures in rats. Control (Ctrl) represents naive animals (no treatment with yeast). Values are means ± S.E.M. (n = 5). ***p < 0.001 compared to vehicle-treated group (Two-way ANOVA followed by Tukey’s multiple comparison test). †p < 0.05; †††p < 0.001 compared to vehicle-treated group (One-way ANOVA followed by Tukey’s multiple comparison test).
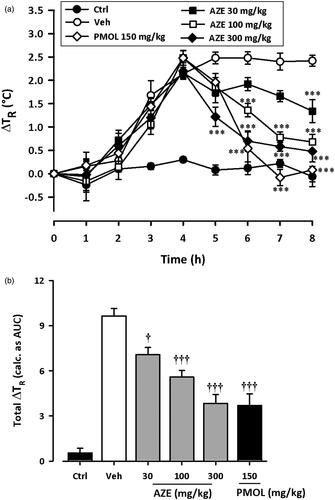
Figure 4. Dose–response effects of AZE (30–300 mg/kg, p.o.) (a, b) and morphine (1–10 mg/kg, i.p.) (c, d) on formalin-induced nocifensive behaviours in rats. Left panels show the time course of effects over the 60 min period and the right panels show the total nociceptive score calculated from AUCs over the first (0-10 min) and second (10–60 min) phases. Nociceptive scores are shown in 5 min time blocks up to 60 min post-formalin injection. Values are means ± S.E.M. (n = 5). *p < 0.05; ***p < 0.001 compared to vehicle-treated group (Two-way ANOVA followed by Tukey’s multiple comparison test). †p < 0.05; ††p < 0.01; †††p < 0.001 compared to vehicle-treated group (One-way ANOVA followed by Tukey’s multiple comparison test).
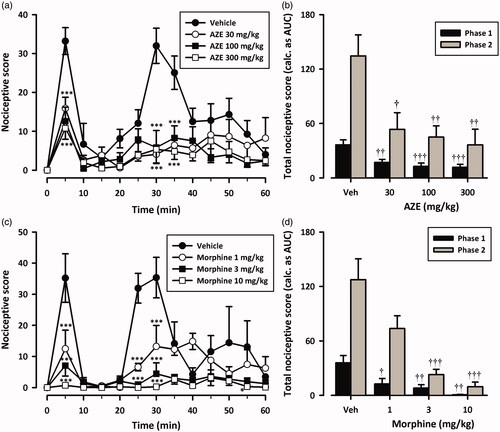
Figure 5. Effect of pretreatment of rats with naloxone on the anti-nociceptive effects of AZE (100 mg/kg, p.o.) (a, b) and morphine (3 mg/kg, i.p.) (c, d) in the formalin test. Left panels show the time course of effects over the 60 min period and the right panels show the total nociceptive score calculated from AUCs over the first (0–10 min) and second (10–60 min) phases. Values are means ± S.E.M. (n = 5). *p < 0.05; **p < 0.01; ***p < 0.001 compared to vehicle-treated group (Two-way ANOVA followed by Tukey’s multiple comparison test). ††p < 0.01; †††p < 0.001 compared to vehicle-treated group; ‡p < 0.05; ‡‡‡p < 0.001 compared to AZE 100 mg/kg or morphine 3 mg/kg (One-way ANOVA followed by Tukey’s multiple comparison test).
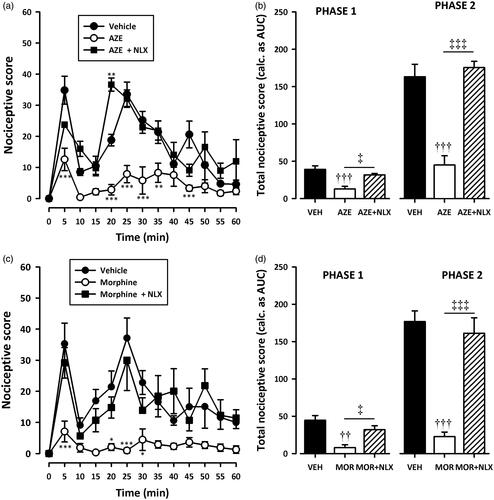
Figure 6. Effect of pretreatment of rats with theophylline on the anti-nociceptive effects of AZE (100 mg/kg, p.o.) (a, b) and morphine (3 mg/kg, i.p.) (c, d) in the formalin test. Left panels show the time course of effects over the 60 min period and the right panels show the total nociceptive score calculated from AUCs over the first (0–10 min) and second (10–60 min) phases. Values are means ± S.E.M. (n = 5). *p < 0.05; **p < 0.01; ***p < 0.001 compared to vehicle-treated group (Two-way ANOVA followed by Tukey’s multiple comparison test). ††p < 0.01; †††p < 0.001 compared to vehicle-treated group; ‡p < 0.05; ‡‡‡p < 0.001 compared to AZE 100 mg/kg or morphine 3 mg/kg (One-way ANOVA followed by Tukey’s multiple comparison test).
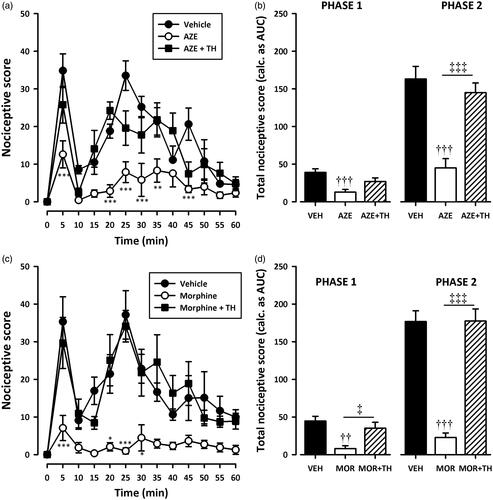
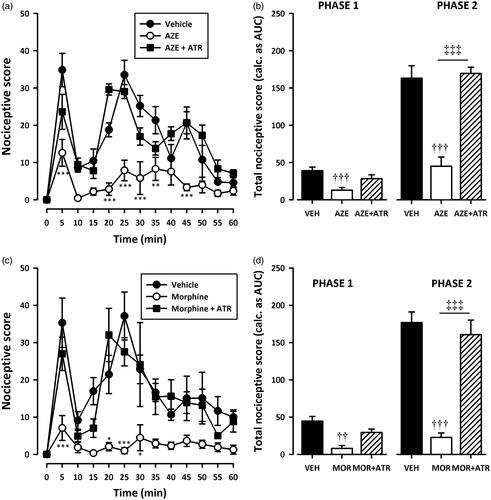
Figure 7. Effect of pretreatment of rats with atropine on the anti-nociceptive effects of AZE (100 mg/kg, p.o.) (a, b) and morphine (3 mg/kg, i.p.) (c, d) in the formalin test. Left panels show the time course of effects over the 60 min period and the right panels show the total nociceptive score calculated from AUCs over the first (0–10 min) and second (10–60 min) phases. Values are means ± S.E.M. (n = 5). *p < 0.05; **p < 0.01; ***p < 0.001 compared to vehicle-treated group (Two-way ANOVA followed by Tukey’s multiple comparison test). ††p < 0.01; †††p < 0.001 compared to vehicle-treated group; ‡‡‡p < 0.001 compared to AZE 100 mg/kg or morphine 3 mg/kg (One-way ANOVA followed by Tukey’s multiple comparison test).