
Figures & data
Table 1. SOD, APX, CAT activities and free proline, AsA, MDA content in the leaves of C. smyrnioides subjected to different relative light intensity: 100% sunlight (Control), 60.54% sunlight (L1), 44.84% sunlight (L2), 31.39% sunlight (L3) and 10.56% sunlight (L4).
Figure 1. Chlorophyll content in the leaves of C. smyrnioides subjected to different relative light intensity: 100% sunlight (Control), 60.54% sunlight (L1), 44.84% sunlight (L2), 31.39% sunlight (L3) and 10.56% sunlight (L4). Different letters denote significant difference at p = 0.05. Means ± standard deviations (S.D.) (n = 3) are shown.
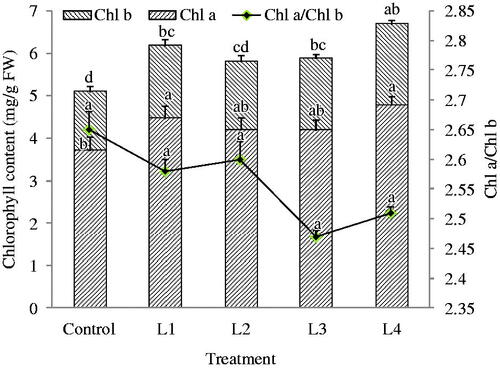
Table 2. Photosynthetic parameters in the leaves of C. smyrnioides subjected to different relative light intensity: 100% sunlight (Control), 60.54% sunlight (L1), 44.84% sunlight (L2), 31.39% sunlight (L3) and 10.56% sunlight (L4).
Figure 2. Dry matter accumulation in the roots of C. smyrnioides subjected to different relative light intensity: 100% sunlight (Control), 60.54% sunlight (L1), 44.84% sunlight (L2), 31.39% sunlight (L3) and 10.56% sunlight (L4). SRL = specific root length. Different letters denote significant difference at p = 0.05. Means ± standard deviations (S.D.) (n = 30) are shown.
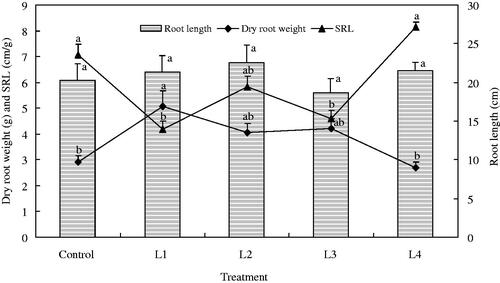
Table 3. The contents of polysaccharides, mannitol, choline and water-soluble components in the roots of C. smyrnioides subjected to different relative light intensity: 100% sunlight (Control), 60.54% sunlight (L1), 44.84% sunlight (L2), 31.39% sunlight (L3) and 10.56% sunlight (L4).
Table 4. Correlation analysis of antioxidant enzyme activities, Pn, free proline (Pro.), AsA, MDA, chlorophyll (Chl.), dry root weight (DRW), polysaccharides (Pol.), mannitol (Man.), choline (Cho.) and water-soluble components (WSE) contents in the roots of C. smyrnioides subjected to different relative light intensity.
Figure 3. HPLC chromatograms on water-soluble components in the roots of C. smyrnioides subjected to different relative light intensity: 100% sunlight (Control), 60.54% sunlight (L1), 44.84% sunlight (L2), 31.39% sunlight (L3) and 10.56% sunlight (L4).
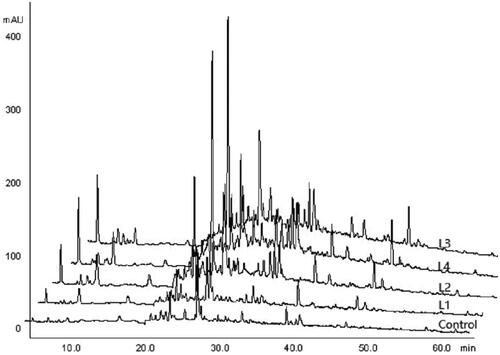
Table 5. Peak areas in water-soluble components in the roots of C. smyrnioides subjected to different relative light intensity: 100% sunlight (Control), 60.54% sunlight (L1), 44.84% sunlight (L2), 31.39% sunlight (L3) and 10.56% sunlight (L4).
Table 6. Similarity coefficients of water-soluble components in the roots of C. smyrnioides subjected to different relative light intensity: 100% sunlight (Control), 60.54% sunlight (L1), 44.84% sunlight (L2), 31.39% sunlight (L3) and 10.56% sunlight (L4).