Figures & data
Table 1. List of species used in the studyTable Footnotea.
Table 2. Average concentration (±SD) of biologically active compounds in selected species of the Boraginaceae family (n = 3).
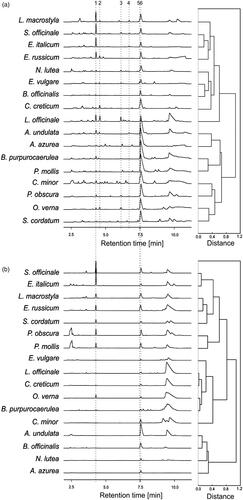
Figure 1. Common pattern of electrophoretic HPEC profiles (left side of the figure) and hierarchical clustering dendrograms of the phytochemical profiles (right side of the figure) of the shoots (a) and the roots (b) of 17 Boraginaceae species studied (n = 3). 1 – allantoin, 2 – rutin, 3 – chlorogenic acid, 4 – p-hydroxybenzoic acid, 5 – hydrocaffeic acid, 6 – rosmarinic acid.