Figures & data
Table 1. MIC/MBC of ethyl acetate and methanol crude extracts of B. Pinnatum and antibiotics (μg/mL).
Table 2. Phytochemical screening of methanol extract of B. pinnatum.
Table 3. Antioxidant activity of Bryophyllum pinnatum methanol extract and vitamin C.
Table 4. Effect of different dose of B. pinnatum and ciprofloxacin on the percentage (%) of H. pylori tested negative animals.
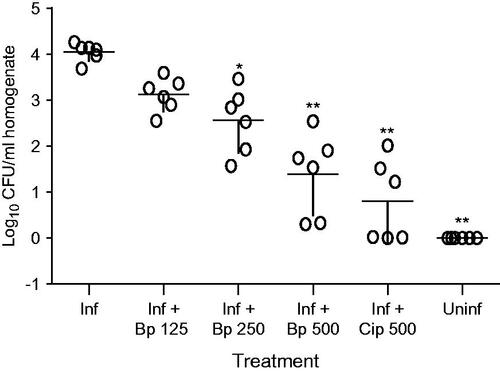
Figure 1. Effects of different treatment on the recovery of H. pylori from infected mice. Each circle represents the bacterial count for one animal. (Inf): infected + vehicle; (Inf + Bp 125): infected + B pinnatum 125 mg/kg; (Inf + Bp 250): infected + B pinnatum 250 mg/kg; (Inf + Bp 500): infected + B pinnatum 500 mg/kg; (Inf + Cp 500): infected + ciprofloxacin 500 mg/kg; (Uninf): normal group. Data column of the different treatment with superscript * are significantly different compared with infected control group (*p < 0.05; **p < 0.01).