Figures & data
Table 1. Validation data of developed method for catechin, diosgenin, gallic acid, quercetin, rutin and tannic acid.
Table 2. Precision and recovery data of developed method for catechin, diosgenin, gallic acid, quercetin, rutin and tannic acid.
Figure 1. Schematic representation of extraction and fractionation of aqueous extract (mother extract) of gokhru showing extractive values.
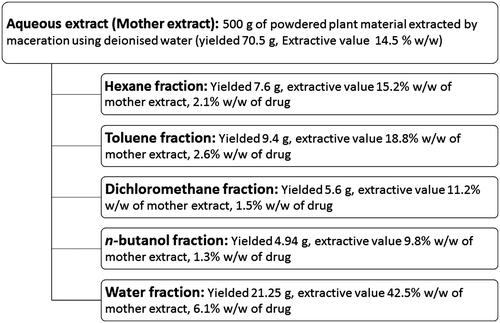
Table 3. Percentage yield of extract and metabolite content in different extract of gokhru.
Figure 2. Effect of different concentrations of extract and fractions of gokhru on calcium oxalate crystallization (A) in synthetic urine and (B) in plasma.
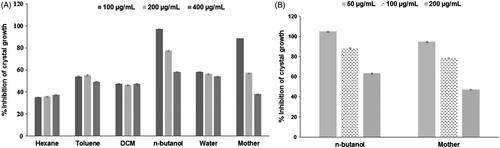
Figure 3. SCIM image sequences of calcium oxalate precipitate showing no increase in crystal size in (A) mother extract (C) n-butanol fraction treated and (B) without drug treated reaction solution, (D) calcium oxalate growth curves exhibit the step-like crystals size with respect to incubation time
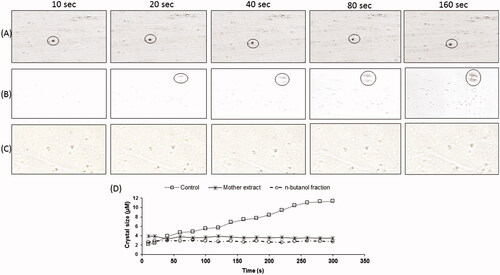
Table 4. Robustness of the developed method for catechin, diosgenin, gallic acid, quercetin, rutin and tannic acid.
Figure 4. HPLC chromatogram of standard marker compounds at (A) 254 nm (tannic acid, rutin and quercetin) and at (B) 278 nm for gallic acid, catechin and diosgenin.
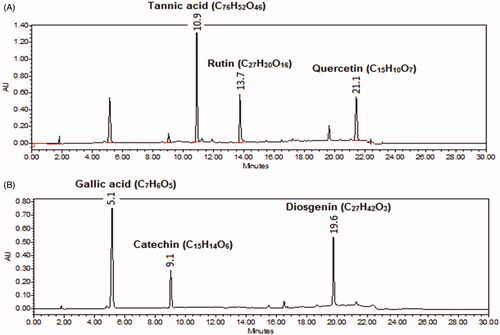
Table 5. System suitability of developed HPLC method for catechin, diosgenin, gallic acid, quercetin, rutin and tannic acid.
Figure 5. HPLC chromatogram of extract at (A) 254 and (B) 278 nm indicating the presence of marker metabolites (tannic acid, rutin and quercetin, gallic acid, catechin and diosgenin) in mother extract of gokhru.
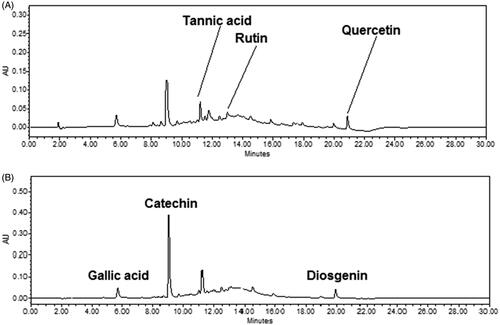
Table 6. Liquid–liquid extraction of catechin, diosgenin, gallic acid, quercetin, rutin and tannic acid from serum.
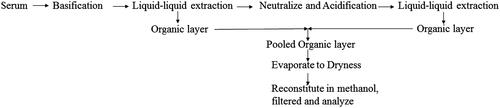
Figure 6. Optimized extraction method for extraction of metabolite marker from serum.