
Figures & data
Table 1. Effect of metformin in presence/absence of bicuculline or wortmannin on T2DM-induced changes in plasma glucose level of T2DM rats in OGTT.
Table 2. Effect of metformin in presence/absence of bicuculline or wortmannin on T2DM-induced changes in the plasma glucose level of T2DM rats in ITT.
Table 3. Effect of metformin in presence/absence of bicuculline or wortmannin on T2DM-induced changes in the fasting blood glucose and insulin level, HOMA-IR and HOMA-B indices of T2DM rats.
Figure 1. The effect of metformin in presence/absence of bicuculline or wortmannin on T2DM-induced changes in the level of hepatic intracellular calcium. All values are mean ± SEM (n = 6). ap < 0.05 compared to control, bp < 0.05 compared to T2DM, cp < 0.05 compared to T2DM + MET dp < 0.05 compared to T2DM + MET + BIC and ep < 0.05 compared to T2DM + MET + WAT (one-way ANOVA followed by Student–Newman–Keuls test).
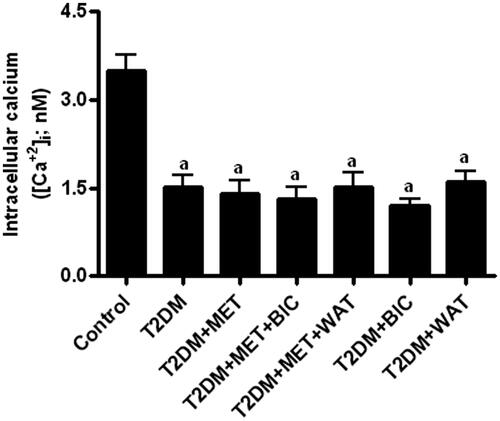
Figure 2. The effect of metformin in presence/absence of bicuculline or wortmannin on the level of expression of Akt (B) and p-Akt (C), and ratio of p-Akt to Akt (D) in liver of T2DM rats. The blots are representative of Akt and p-Akt in liver (A). The results in the histogram are expressed as the ratio of relative intensity of levels of expression of Akt or p-Akt to β-actin. All values are mean ± SEM of three separate sets of independent experiments. ap < 0.05 compared to control, bp < 0.05 compared to T2DM and cp < 0.05 compared to T2DM + MET [One-way ANOVA followed by Student–Newmann–Keuls post-hoc test].
![Figure 2. The effect of metformin in presence/absence of bicuculline or wortmannin on the level of expression of Akt (B) and p-Akt (C), and ratio of p-Akt to Akt (D) in liver of T2DM rats. The blots are representative of Akt and p-Akt in liver (A). The results in the histogram are expressed as the ratio of relative intensity of levels of expression of Akt or p-Akt to β-actin. All values are mean ± SEM of three separate sets of independent experiments. ap < 0.05 compared to control, bp < 0.05 compared to T2DM and cp < 0.05 compared to T2DM + MET [One-way ANOVA followed by Student–Newmann–Keuls post-hoc test].](/cms/asset/52c03f36-9b1f-4447-ade5-5498537ba991/iphb_a_1268635_f0002_c.jpg)
Figure 3. The effect of metformin in presence/absence of bicuculline or wortmannin on the level of expression of cytoplasmic (B) and membranous (C), and ratio of p-membranous to cytoplasmic (D) GLUT-4 in liver of T2DM rats. The blots are representative of cytoplasmic and membranous (A) GLUT-4 in liver. The results in the histogram are expressed as the ratio of relative intensity of levels of expression of cytoplasmic or membranous GLUT-4 to β-actin. All values are mean ± SEM of three separate sets of independent experiments. ap < 0.05 compared to control, bp < 0.05 compared to T2DM and cp < 0.05 compared to T2DM + MET [One-way ANOVA followed by Student–Newmann–Keuls post hoc test].
![Figure 3. The effect of metformin in presence/absence of bicuculline or wortmannin on the level of expression of cytoplasmic (B) and membranous (C), and ratio of p-membranous to cytoplasmic (D) GLUT-4 in liver of T2DM rats. The blots are representative of cytoplasmic and membranous (A) GLUT-4 in liver. The results in the histogram are expressed as the ratio of relative intensity of levels of expression of cytoplasmic or membranous GLUT-4 to β-actin. All values are mean ± SEM of three separate sets of independent experiments. ap < 0.05 compared to control, bp < 0.05 compared to T2DM and cp < 0.05 compared to T2DM + MET [One-way ANOVA followed by Student–Newmann–Keuls post hoc test].](/cms/asset/09fbb6f5-db58-4944-9400-147d52a4bf68/iphb_a_1268635_f0003_b.jpg)