Figures & data
Figure 1. Growth inhibitory and chemo-sensitizing effects of silibinin in MDA-MB 435/WT cell line. (A) The dose-response cure for the growth inhibitory effects of silibinin assessed by MTT. (B) Cell cycle analysis by PI staining and flow cytometry. (C) Morphological alterations in MDA-MB-435/WT cells at 48 h post incubation with silibinin at concentration of 200 μM (40x magnification). (D) The synergistic growth inhibitory effects of silibinin and DOX measured by MTT. (E) Analysis of apoptosis by AnnexinV/PI assay.
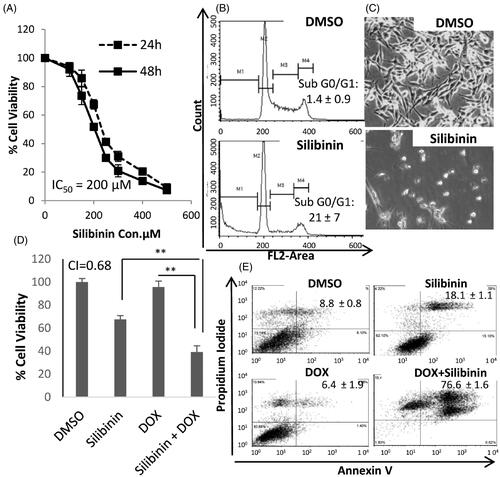
Figure 2. Anticancer effects of silibinin in MDA-MB-435/DOX cells. (A) The dose-response cure for the growth inhibitory effects of silibinin assessed by MTT. (B) Cell cycle analysis by PI staining and flow cytometry. (C) Analysis of apoptosis by AnnexinV/PI assay. (D) Morphological alterations in MDA-MB-435/DOX cells at 48 h post incubation with silibinin at concentration of 290 μM (40x magnification).
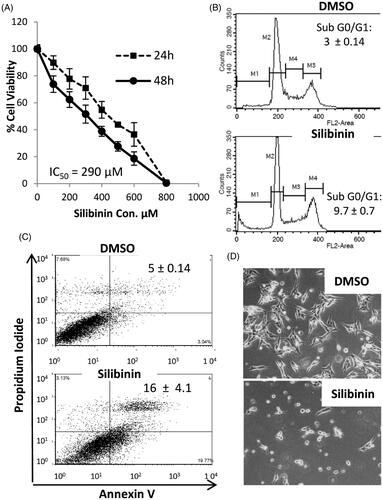
Figure 3. Synergistic anticancer effects of silibinin and DOX in MDA-MB-435/DOX cells. (A) Growth inhibitory effects of DOX in combination with 200 μM concentration of silibinin measured by MTT. (B) Growth inhibitory effects of silibinin alone at 200 μM concentration. (C) The effects of silibinin on IC50 of DOX in MDA-MB-435/DOX cells. (D) The growth inhibitory effects of cisplatin alone or in combination with silibinin at 200 μM concentration in MDA-MB-435/DOX cells.
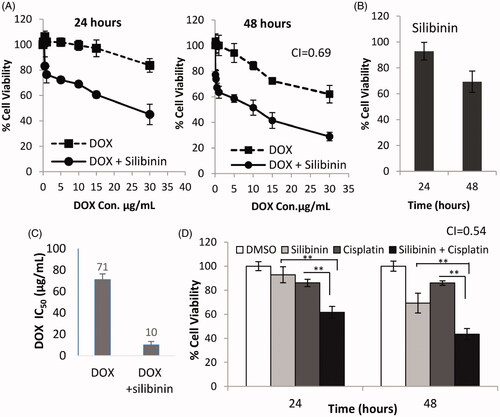
Figure 4. Suppressive effects of silibinin on key oncogenic pathways in MDA-MB-435/WT and MDA-MB-435/DOX cell lines. Western blotting was used to measure the level of oncogenic proteins in the cells treated with an increasing concentration of silibinin. These results are representative of three independent experiments.
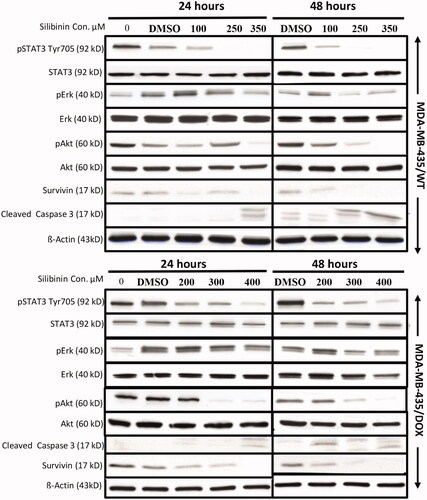
Figure 5. The effects of silibinin on tumorigenicity of MDA-MB-435. MDA-MB435/WT and MDA-MB435/DOX cells were treated with silibinin for 48 h then they are detached and subjected to mammosphere assay. The colonies were counted after 7 days. The right panel illustrates the morphology of the colonies (40× magnification).
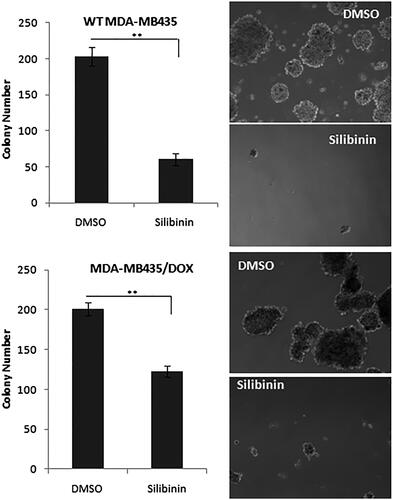
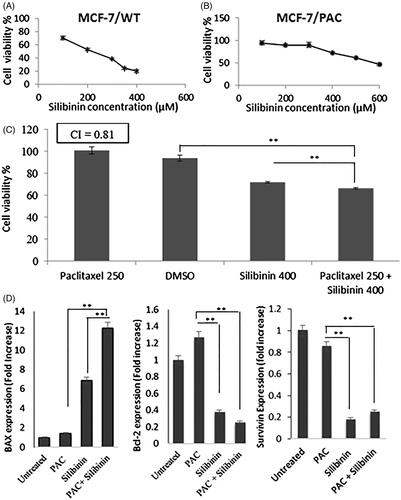
Figure 6. Growth inhibitory and chemo-sensitizing effects of silibinin in MCF-7 cells. Dose-response curve for the growth inhibitory effects of silibinin in (A) MCF-7/WT cell line and (B) MCF-7/PAC cell line. (C) The anticancer effects of PAC in combination with silibinin in MCF-7/PAC. (D) The effects of PAC and/or silibinin after 48 h incubation with MCF-7/PAC cells on the expression level of apoptosis-related proteins measured with RT-PCR.